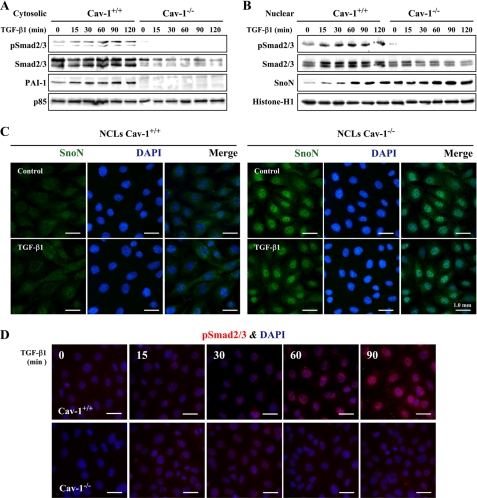
FIGURE 3.
SnoN accumulates in NCL Cav-1−/− cells. NCL Cav-1+/+ and NCL Cav-1−/− cells (2–3 × 10⁶) were treated with 5 ng/ml TGF-β1 at the indicated times. Cytosolic (50 μg) (A) and nuclear extracts (10 μg) (B) were obtained, and protein levels of total and pSmad2/3, PAI-1, and SnoN were analyzed. A representative blot is shown. Blots were normalized with p85 for cytosolic extracts and with histone-H1 for nuclear extracts. C, immunofluorescence analysis of SnoN in NCL cells after 1 h of TGF-β1 stimulation. DAPI, 4′,6-diamidino-2-phenylindole. D, immunofluorescence analysis of pSmad2/3 in NCL cells after TGF-β1 stimulation at the indicated times. Neonatal Cav-1+/+ or Cav-1−/− cells (5 × 10⁴) were cultured in 24-multiwell plates on glass coverslips and maintained overnight with 1% FBS. After that period, the cells were fixed for 15 min with 4% paraformaldehyde, pH 7.2, washed with phosphate-buffered saline, and permeabilized with 1% Tween 20 in phosphate-buffered saline for 15 min at room temperature. After blocking with 3% bovine serum albumin for 1 h at room temperature, the cells were incubated 2 h with the corresponding Abs diluted 1:150 in 1% bovine serum albumin, washed several times, and incubated for 2 h with fluorochrome-conjugated Abs (Invitrogen) raised against Fc of primary Abs and treated with 4′,6-diamidino-2-phenylindole for 30 min at room temperature. The glass coverslips were mounting with Vectashield (Vector Laboratories, Burlingame, CA) on microscope slides. The images were acquired in a fluorescence Eclipse E400 microscope (Nikon).

