FIGURE 2.
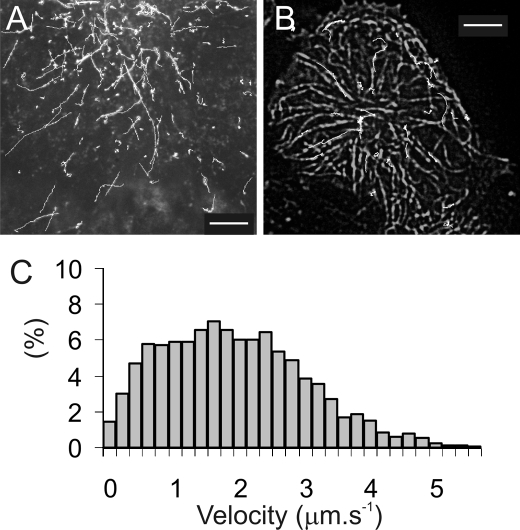
The delivery of KCNQ1-GFP containing vesicles to the plasma membrane of HEK-293 cells visualized by TIRFM at 37 °C. A, shows trajectories (white lines) of KCNQ1-GFP containing vesicles moving within HL1 cells. The initial frame in the video sequence is shown overlaid and illustrates how the low background imaging provided by TIRM allows individual vesicles to be tracked as they move toward the cell periphery. B, dual color TIRF imaging of HL-1 cells co-transfected with KCNQ1-GFP-KCNE1 and mRFP-tubulin shows that vesicle tracks (white lines) follow closely the path of microtubules shown as the overlaid image. Scale bars are 5 μm. C, a histogram showing the distribution of velocities measured for the vesicles tracked above indicates a mean velocity of 1.8 μm s−1.

