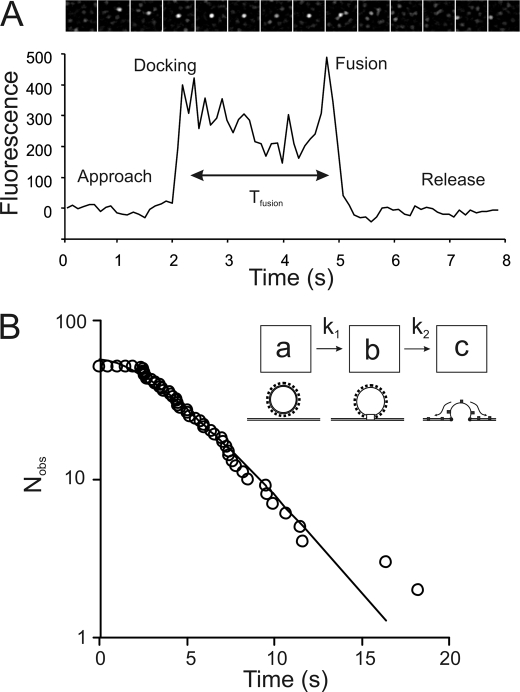
FIGURE 3.
A, the characteristic time course of KCNQ1-GFP-KCNE1 vesicle fusion consisting of approach, docking, fusion, and then release of ion channels from an individual vesicle. Fluorescence intensity at the fusion zone (0.5 × 0.5 μm2 region) is plotted against time. The panel of images above shows a film strip of an area (3.5 × 3.5 μm2) around the fusion site. The images are aligned roughly to correspond to the intensity versus time plot below. The graph shows how intensity rises abruptly when the vesicle arrives at the fusion site (“docking” at t = 2 s), declines slightly due to photobleaching and rises again shortly before ion channel release (“fusion” at t = 5 s). TIRFM imaging of HEK-293 cells were recorded at 37 °C. B, to investigate the kinetics of the fusion process, the distribution of “docked” vesicle lifetimes (time, Tfusion, in panel A) were plotted as a cumulative frequency plot (i.e. number of intact vesicles remaining after each time interval) against time. The lifetimes do not fit to a single exponential process but instead fit moderately well to a two-step kinetic process. The kinetic scheme (inset) shows how two sequential processes might be required for the docking and fusion process (schematic). The least squares fitted line is given by the solution to such a two-step sequential scheme. The fitted line here and elsewhere in the paper was obtained by iterative, least squares error minimization based on a generalized reduced gradient method (using the ExcelTM, “Solver” option). The goodness to fit (given by χ2 value) is better than 95% here and for all other fitted lines except where indicated otherwise. The functional form of the fitted line is of a two-step, sequential, biochemical process: At= A0 (e−k1t + ((k1)/(k2 − k1) e−k1t − (k1)/(k2 − k1) e−k2t), where A0 = 57; k1 = 0.33 s−1; k2 = 0.34 s−1.

