FIGURE 5.
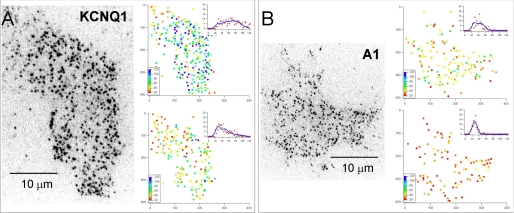
Individual molecular complexes were visualized using TIRF microscopy. A and B, left-hand panels show single video frames captured at the start of experiments in which KCNQ1-GFP and A1-GFP adenosine receptors were imaged using TIRFM. The images are displayed using an inverted grayscale lookup table so that individual fluorescent spots appear black on a white background. The two panels on the right of each figure show individual spots as a color-coded dot plot that represents the mean pixel intensity, integrated over a 5 × 5 pixel region. A histogram of the spot intensities and a least-squares fit to the sum of four Gaussian curves (see Fig. 6 for description) is show as an inset graph. The upper panels are data obtained at the start of the recording period and the lower panels are data collected toward the end of the recording (about 3 s later). The entire video sequence, the corresponding dot-plot representations, and intensity histograms are shown animated in supplemental Movies 7–10.

