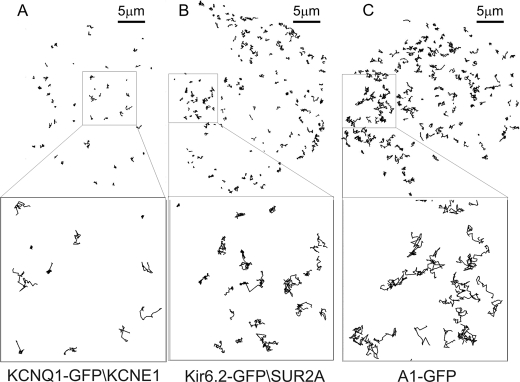
FIGURE 7.
Imaging of single ion channels using TIRFM in live HL1 cells at 37 °C (see supplemental movies) allows individual molecular trajectories to be followed in space and time. Custom image analysis software analyses the tracks of individual, diffraction limited spots corresponding to the location of each molecule. The diagrams show tracks determined for different proteins over a 15-s interval. A, trajectories of individual KCNQ1-GFP-KCNE1 ion channels is shown with the inset below showing a zoomed area. B, Kir6.2-GFP-SUR2A, lower inset shows the zoomed area. C, A1-GFP, lower inset shows the zoomed area.

