Abstract
Lipopolysaccharide (LPS), the major constituent of the outer membrane of Gram-negative bacteria, is an important element against permeability of bactericidal agents, including antimicrobial peptides. However, structural determinants of antimicrobial peptides for LPS recognition are not clearly understood. Pardaxins (Pa1, Pa2, Pa3, and Pa4) are a group of pore-forming bactericidal peptides found in the mucous glands of sole fishes. Despite having a low net positive charge, pardaxins contain a broad spectrum of antibacterial activities. To elucidate the structural basis of LPS interactions of pardaxins, herein, we report the first three-dimensional structure of Pa4 bound to LPS micelles. The binding kinetics of Pa4 with LPS is estimated using [15N-Leu-19] relaxation dispersion NMR experiments. LPS/Pa4 interactions are further characterized by a number of biophysical methods, including isothermal titration calorimetry, 31P NMR, saturation transfer difference NMR, dynamic light scattering, and IR spectroscopy. In the LPS-Pa4 complex, Pa4 adopts a unique helix-turn-helix conformation resembling a “horseshoe.” Interestingly, the LPS-bound structure of Pa4 shows striking differences with the structures determined in lipid micelles or organic solvents. Saturation transfer difference NMR identifies residues of Pa4 that are intimately associated with LPS micelles. Collectively, our results provide mechanistic insights into the outer membrane permeabilization by pardaxin.
Keywords: Antibiotics, Biophysics, Membrane/Nuclear, Membrane/Proteins, Methods/NMR, Methods/Spectroscopy, Protein/Binding/Lipid
Introduction
Antimicrobial peptides (AMPs)3 are ubiquitous arsenals of all living organisms for combating against invading pathogens (1–3). The onset of drug resistance bacteria has made AMPs an important avenue to explore for future therapy (4–8). Cytolytic activities of most of the AMPs stem from their membrane permeabilization property (1–5). Gram-negative bacteria are characterized by two distinct membranes namely the inner phospholipid membrane and an outer membrane composed of a highly conserved and chemically unique lipid called lipopolysaccharide (LPS) (9–10). Chemically, the amphiphilic LPS consists of hydrophilic polysaccharide components with negatively charged phosphate and carboxyl groups and a lipid moiety with six to seven acyl chains termed as lipid A. The outer membrane or LPS has been thought to evolve for protection of bacteria against antibacterial molecules (10–13). Since then, several studies have demonstrated modifications of LPS in drug- and AMP-resistant strains (14–17). To be active, AMPs should interact or disrupt the integrity of the outer membrane to gain access into the inner membrane (18–21). Furthermore, LPS is well known as a potent inducer of the innate immune system that often causes septic shock in the intensive cares (22, 23). Many AMPs are found to have LPS-neutralizing ability (24, 25). Despite these facts, our structural knowledge of AMPs in the context of lipid membranes is mostly derived from synthetic lipid micelles that typically mimic the inner cytoplasmic membrane. Structures and interactions of AMPs with LPS, therefore, will be important to glean our understanding in AMPs mechanisms and structure/activity correlations.
Pardaxins, including Pa4, studied here, are 33-residue excitatory polypeptide toxins. They are released by the Red Sea Moses sole fish Pardachirus marmoratus (26) and the Pacific peacock sole fish Pardachirus pavoninus (27) to function as a fish defense peptide. Pardaxins have been studied extensively as a model for pore-forming membrane-active peptides and are endowed with various concentration-dependent biological activities ranging from channel-forming neurotoxins to antimicrobial activities (28–36). Antibacterial activities of pardaxins are similar to magainin, cecropins, and dermaseptins (35). However, pardaxins are 40- to 100-fold less hemolytic than melittin toward human erythrocytes (35). Several analogs of pardaxins had been studied identifying sequence elements responsible for various activities (33, 36, 37). The pore-forming activity of pardaxins, deduced from experiments in lipid vesicles, had been proposed to occur as a result of peptide aggregations (28–32). Solid-state NMR experiments pointed out the membrane orientation and interactions of pardaxins, hence mechanisms of action, are highly dependent on compositions of lipids in the bilayers (38, 39). The NMR structure of Pa4 in zwitterionic DPC micelles demonstrated a well defined C-terminal helix and a rather flexible turn/helix structure at the N-terminal (40). On the other hand, an NMR structure of Pa1 determined in helicogenic solvent 2,2,2-trifluoroethanol/water mixture showed a short helix at the N-terminal and a longer C-terminal helix connected by a bend (41). A recent polarization inversion spin exchange at the magic angle (42) solid-state NMR investigation revealed the role of cholesterol on the dynamics of Pa4 embedded in lipid bilayers and its barrel-stave mechanism (43).
In this study, tr-NOESY (44, 45), STD NMR (46, 47), and CPMG relaxation dispersion (48, 49) experiments were used to determine three-dimensional structure of pardaxin Pa4, and the localization of the amino acid residues in LPS and binding kinetics of the complex. Further, membrane permeability assay, CD, ITC, IR, dynamic light scattering (DLS), and 31P NMR studies of peptide/LPS revealed the binding and molecular mechanisms underlying the outer membrane disruption by Pa4.
EXPERIMENTAL PROCEDURES
Reagents
LPS of Escherichia coli 0111:B4 and fluorescein isothiocyanate (FITC)-conjugated LPS from E. coli 055:B5 were purchased from Sigma. Pa4 was synthesized by solid-phase peptide synthesis method containing a [15N-Leu-19] label and purified as described before (38).
NPN Uptake Assay
The outer membrane permeabilization activity of Pa4 was analyzed by using an 1-N-phenylnaphthylamine (NPN) dye uptake assay (50). E. coli BL21(DE3) cells were grown in LB broth to mid-log phase (A600 of 0.38), centrifuged at 3000 × g for 10 min at 298 K, and resuspended in buffer containing 5 mm sodium HEPES buffer, pH 7.2, 5 mm glucose, and 5 mm NaN3. After washing once, the pellet was resuspended in the same buffer to a final A600 of 0.5. The basal fluorescence level of 500 μl of treated cells was acquired using a Cary Eclipse fluorescence spectrophotometer (Varian, Inc., Palo Alto, CA). Excitation and emission wavelengths used for this assay were 350 nm and 420 nm, employing bandwidths of 5 nm, respectively. NPN, at a concentration of 10 μm, was added to the cells, and a new basal fluorescence level was recorded after 5 s. Assay controls (5 μm polymyxin B as positive control) and increasing concentrations of pardaxin (3–15 μm) were added, and NPN fluorescence spectra were obtained in the presence of cells. Fluorescence intensity data were analyzed after subtracting the background level of fluorescence of NPN alone.
Secondary Structure by CD Spectroscopy
Secondary structure was determined for Pa4, 100 μm, in 10 mm sodium phosphate buffer at pH 4.5, at 298 K, in the absence and presence of 100 μm LPS from E. coli 0111:B4. CD data were collected using a Chirascan CD spectrometer (Applied Photophysics Ltd., UK). The far-UV CD spectra were scanned over the range of 180–235 nm wavelengths in a 0.01-cm path length cuvette, using a bandwidth of 1 nm, step size of 0.4 nm, a time of 5 s at each wavelength, and averaging over three scans. Baseline scan was obtained using the same parameters on buffer alone, and it was subtracted from the data scan of Pa4. The corrected data obtained in millidegrees (θ) was converted to molar ellipticity in deg.cm2 dmol−1.
ITC
All isothermal titration calorimetry (ITC) experiments were performed on a VP-ITC Micro-Calorimeter (MicroCal Inc., Northampton, MA) in 10 mm sodium phosphate buffer at pH 6.2. Prior to titration, LPS samples were vortexed for 15 min, heated at 60 °C for 5 min, and sonicated for 2 min. The molecular mass for E. coli 0111:B4 LPS was considered to be 10 kDa (51). A typical titration involved 30 injections of 1 mm pardaxin (10 μl per injection, except first injection of 3 μl) at 400-s intervals, into the sample cell (volume 1.4 ml) containing 50 μm LPS. The reaction cell was stirred continuously at 300 rpm. The high feedback level of mode/gain was selected. The titrations were carried out at two different temperatures, 298 K and 313 K. Raw data were corrected for the heat of dilution of Pa4 in buffer and integrated using a MicroCal Origin 5.0 supplied by the manufacturer. The first data point (3-μl injection) was not considered for the analysis. A single site binding model was used to fit the data using a non-linear least square method yielding the binding stoichiometry (n), equilibrium association constant (Ka), and enthalpy change (ΔH). The change of free energy (ΔG) and the change of entropy (ΔS) were calculated using the fundamental equations of thermodynamics, ΔG = −RT ln Ka and ΔS = (ΔH − ΔG)/T, respectively.
Size Distribution of LPS by DLS
Particle size distributions of LPS micelles in free and in the presence of Pa4 were investigated using DLS measurements, performed on a BI-200SM instrument equipped with a He-Ne laser and a BI-900AT autocorrelation system (Brookhaven Instruments Corp., Holtsville, NY). E. coli 0111:B4 LPS, 1 μm, dissolved in a 10 mm sodium phosphate buffer, pH 6.2 at 298 K, was exposed to 90° light scattering for 3 min. DLS measurements were recorded for LPS in the presence of 2 μm Pa4, under similar conditions. All samples were filtered, degassed, and scanned using a 1-mm path length quartz cuvette. DLS data were analyzed by using the CONTIN method supplied by the manufacturer.
NMR Spectroscopy
All NMR spectra were recorded on a Bruker DRX 600 spectrometer, equipped with a cryo-probe and pulse field gradients. Data acquisition and processing were performed with the Topspin software (Bruker) running on a Linux workstation. Two-dimensional TOCSY (total correlation spectroscopy) and NOESY (nuclear Overhauser effect spectroscopy) spectra of Pa4 in free solution were acquired in an aqueous solution containing 10% D2O at pH 4.5 with 0.5 mm peptide concentration and mixing times of 80 ms and 150 ms, respectively. The measurements were performed at two different temperatures (288 and 298 K) using 80 scans and 2,2-dimethyl-2-silapentane 5-sulfonate sodium salt) as an internal standard (0.0 ppm). However, due to severe signal overlap at 298 K, the resonance assignments of Pa4 in aqueous solution were done at 288 K. A 0.5 mm solution of Pa4 was titrated with various concentrations of LPS, ranging from 9 to 74 μm. The two-dimensional tr-NOESY experiments were performed at the molar ratio of [LPS]:[Pa4] = 1:12.5 with three different mixing times (100, 150, and 200 ms) and at two different temperatures (288 and 298 K). NOESY and tr-NOESY experiments were performed with 456 increments in t1 and 2K data points in t2 using the WATERGATE procedure for water suppression and States-TPPI for the quadrature detection in the t1 dimension. The spectral width was typically 12 ppm in both dimensions. After zero filling along the t1 dimension, 4K (t2) × 1K (t1) data matrices were obtained. NMR data processing and analysis were carried out using Topspin (Bruker) and SPARKY4 programs, respectively.
For the one-dimensional STD experiments, LPS was saturated at −2.0 ppm (40.0 ppm for reference spectra) with a cascade of 40 selective Gaussian-shaped pulses (49 ms each) in an interval of 1 ms resulting in total saturation time of 2 s. The two-dimensional STD TOCSY spectra were recorded with 350 t1 increments and 80 transients using a MLEV-17 spin lock field of 80 ms. The relaxation delay was set to 2.1 s. Saturation transfer was achieved by using 40 selective Gaussian 270 pulses with a duration of 50 ms. The LPS resonances were irradiated at −2.0 ppm (on-resonance) and 40.0 ppm (off-resonance) for 2 s. Subtraction of the two spectra (on resonance off-resonance) by phase cycling (46) leads to the difference spectrum that contains signals arising from the saturation transfer. As a control, one-dimensional STD experiments were performed using an identical experimental setup with the same peptide concentration but in the absence of LPS.
Interactions of Pa4 with LPS were examined by recording a series of one-dimensional 31P NMR spectra of LPS whereby 0.2 mm of LPS in water at a pH 4.5 was titrated with various concentrations, 0.05, 0.1, 0.2, and 0.4 mm, of Pa4 at 298 K. The 31P NMR spectra were recorded on a Bruker DRX 400 spectrometer.
Relaxation Dispersion Measurements
The binding kinetics parameters of Pa4 [15N-Leu-19] to LPS (molar ratio of [LPS]:[Pa4] = 1:12.5) were obtained from two dimensional 1H-15N relaxation dispersion measurements using the Carr-Purcell-Meiboom-Gill (CPMG) pulse sequence (48, 49) on a Bruker DRX 700 spectrometer, equipped with an actively shielded cryo-probe and pulse field gradients. The total CPMG period (Tr1x) was 60 ms in all the experiments, and the effective field strength was varied by changing the delay time (tcp) between consecutive 15N 180° refocusing pulses, ranging from 7.76 and 0.67 ms in 9 experiments with two duplicates for error estimation. A reference experiment was also performed by omitting the CPMG sequence. Effective R2 rates were calculated as described elsewhere (52). To determine the exchange kinetics, effective relaxation rates (R2) as a function of inverse of the delay time (tcp) were fitted to the Carver-Richards model (46) using an in-house C-program yielding kex and pb values. The grid-search algorithm was used to minimize the errors to the initial input values.
NMR-derived Structure Calculation
NMR structures were calculated using the DYANA program (version 1.5) (53) as described previously (54). Briefly, on the basis of cross-peak intensities from the tr-NOESY spectra recorded at a mixing time of 150 ms, the NOE intensities were qualitatively categorized to strong, medium, and weak and then translated to upper bound distance limits to 2.5, 3.5, and 5.0 Å, respectively. The LPS-bound conformation of Pa4 was calculated solely based on tr-NOE-derived distance constraints. To restrict the conformational search, the ϕ dihedral angles were set to −30° to −120° for all residues except for Gly and Pro. No hydrogen bond constraints were used for structure calculations. Several rounds of structure calculations were carried out, and, depending on NOE violations, the distance constraints were adjusted. Out of the 100 structures, the 20 lowest energy structures were used for further analysis.
Infrared Spectroscopy
Fourier transform IR spectra were recorded on a Nicolet Nexus 560 spectrometer (Madison, WI) purged with N2 and equipped with an MCT/A detector cooled with liquid nitrogen. Attenuated total reflection spectra were measured with a 25-reflection attenuated total reflection accessory from Graseby Specac (Kent, UK) and a wire grid polarizer (0.25 mm, Graseby Specac). Approximately 200 μl of a D2O solution of LPS alone or in the presence of peptide in a 20:1 lipid/peptide molar ratio was applied onto a trapezoidal (50 mm × 2 mm × 20 mm) germanium internal reflection element. A dry, or D2O-saturated, N2 stream flowing through the attenuated total reflection compartment was used to remove the bulk water (low hydration) or to fully hydrate the sample (high hydration), respectively. A total of 200 scans was collected at a resolution of 4 cm−1, averaged, and processed with one-point zero filling and Happ-Genzel apodization. The secondary structure composition of the peptide was obtained by analyzing the amide I band of the non-polarized spectrum, using previous assignments (55). Main component bands were identified after mild Fourier deconvolution (full width half-height 20 cm−1 and k 2.5). Non-polarized spectra were obtained from the parallel (‖) and perpendicularly (⊥) attenuated total reflection polarized spectra, using the expression, 1(‖) + 1.44(⊥), as described previously (56).
RESULTS
Disruption of Outer Membrane Integrity by Pa4
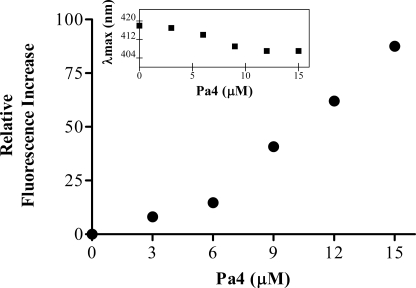
We have examined whether Pa4 can permeabilize outer membrane by use of NPN uptake assay. NPN is a neutral, hydrophobic probe that fluoresces weakly in an aqueous environment, but strongly in the hydrophobic milieu of a membrane. When NPN was mixed with intact E. coli cells, it emitted a weak fluorescence at 515 nm, as it was unable to penetrate the outer membrane permeability barrier. Upon subsequent additions of Pa4, NPN partitioned into the hydrophobic region of the membrane and demonstrated an enhanced fluorescence intensity (Fig. 1). A dose-dependent increase in the fluorescence intensity was observed, indicating the loss of outer membrane integrity. A marked blue shift (∼14 nm) in NPN fluorescence emission maxima (Fig. 1, inset) further indicates that NPN is well inserted into the non-polar environment of E. coli cell membranes. These data demonstrate that Pa4 efficiently permeabilizes the outer membrane as observed for the inner membrane.
FIGURE 1.
Outer membrane permeabilization of Pa4. Enhancement of fluorescence intensity of NPN as a function of concentrations of Pa4 in E. coli cells. The experiments were carried out in 10 μm NPN dye mixed with E. coli BL21(DE3) cells in 5 mm HEPES (pH 7.2), 5 mm glucose, and 5 mm NaN3 buffer. Inset, changes in the emission maxima (λmax) of NPN upon partitioning into hydrophobic membranes.
Secondary Structure of Pa4 in LPS Micelles
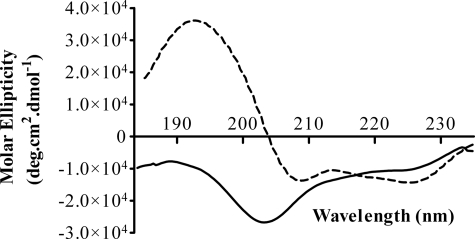
In aqueous solution, the far-UV CD spectrum of Pa4 is characterized by a strong negative band at ∼200 nm (Fig. 2), representative of random-coil like conformations. This observation is in accordance with previous CD studies, which reported that the pardaxins are mostly unstructured in aqueous solution (35, 37). But a drastic change in the CD spectrum of Pa4 in the presence of LPS indicates structural changes of Pa4 upon binding to LPS (Fig. 2). A very strong positive band at ∼192 nm and two negative maxima of approximately equal intensity at ∼222 nm and at ∼208 nm, typically observed for a protein rich in helical conformations. This observation clearly demonstrates that the Pa4 has random conformations in aqueous buffer but adopts predominantly helical structures in the context of LPS micelles.
FIGURE 2.
Secondary structures of Pa4 in free and LPS-bound forms by CD spectroscopy. Far-UV CD spectra of 100 μm Pa4 in the absence (solid line) and presence (dashed line) of 100 μm LPS from E. coli 0111:B4 in 10 mm sodium phosphate, pH 4.5, at 298 K.
Binding Affinity of Pa4 to LPS
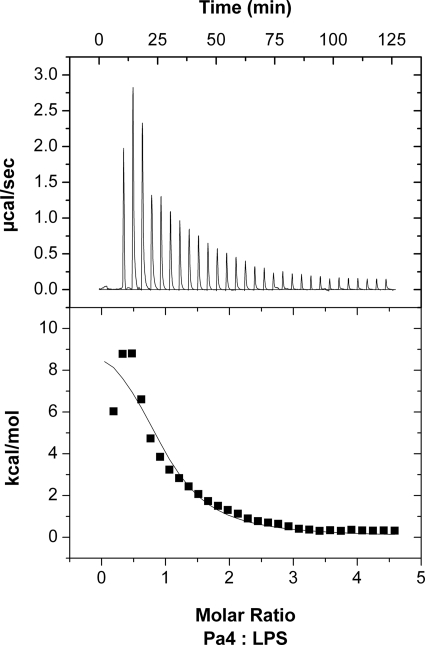
ITC was used to determine the energetic of interactions and equilibrium binding constants involving Pa4 and LPS. The binding of Pa4 to LPS was determined by titrating Pa4 into LPS solutions at pH 6.2, at 298 K and 313 K. At 298 K, the interaction was found to be endothermic in nature, as evident by the upward position of titration peaks and the corresponding positive integrated heats (Fig. 3). In other words, binding is entropically driven and hence hydrophobic in nature. However, at 313 K, above the phase transition temperature of LPS, the interactions became exothermic, as seen with the downward position of titration peaks and the corresponding negative integrated heats (ΔH < 0) (Table 1 and supplemental Fig. S1); these results suggest that the binding reaction is enthalpically driven. This temperature-dependent behavior (endothermic to exothermic transition) of LPS-peptide interactions has been attributed to the gel phase to liquid phase transition of LPS micelles (57, 58). However, irrespective of the phase transition thermodynamic effects, Pa4 binds to LPS with a similar equilibrium binding association constant (Ka) of ∼ 0.1 μm−1 and 0.15 μm−1 at 298 and 313 K, respectively (Table 1).
FIGURE 3.
Binding energetic for Pa4-LPS interaction by ITC. Calorimetric trace of 1 mm Pa4 titrated into 0.05 mm E. coli LPS 0111:B4 in 10 mm sodium phosphate, pH 6.2, is shown at 298 K. The upper panel shows the titrated peaks plotted as power (microcalories s−1) against time (minutes). The lower panel shows the corresponding integrated heat levels of binding.
TABLE 1.
Thermodynamic parameters of Pa4 binding to E. coli LPS in 10 mm sodium phosphate buffer, pH 6.2, at 298 K and 313 K
| Parameters | 298 K | 313 K |
|---|---|---|
| KA (μm−1) | 0.10 ± 0.04 | 0.15 ± 0.03 |
| KD (μm) | 8.5 ± 1.5 | 7.0 ± 1.3 |
| ΔH (kcal·mol−1) | 10.3 ± 1.3 | −0.686 ± 0.04 |
| TΔS (kcal·mol−1 deg−1) | 17.1 | 6.76 |
| ΔG (kcal·mol−1) | −6.82 | −7.42 |
Conformations of Isolated Pa4
A nearly complete sequence-specific proton resonance assignment of Pa4 in aqueous solution was achieved by the analysis of two-dimensional 1H-1H NOESY and TOCSY (59) spectra (supplemental Table S1). The primary amino acid sequence of 33-residue Pa4 contains as many as 7 Ser, 5 Leu, 3 Phe, 3 Ile, and 3 Gly residues. In our experimental conditions (see “Experimental Procedures”) most of the resonances from these amino acids were unambiguously assigned (supplemental Table S1). The free-state NOESY spectrum of Pa4 is characterized by the presence of intra-residue and sequential NOEs between the backbone protons and the side-chain protons of Pa4 (supplemental Fig. S2A). The lack of any diagnostic NOEs clearly shows that Pa4 does not adopt any unique conformation(s) in the free solution, which is in agreement with the CD data (Fig. 2) and other studies of pardaxins in aqueous solution (36, 37).
Binding Kinetics of Pa4 in Complex with LPS
Additions of aliquots of LPS into solutions containing Pa4 showed a concentration-dependent broadening of almost all the proton resonances of the peptide, without any significant changes in the chemical shifts (supplemental Fig. S2B). This observation demonstrates that the Pa4 undergoes a fast exchange between its free and LPS-bound states at the NMR time scale.
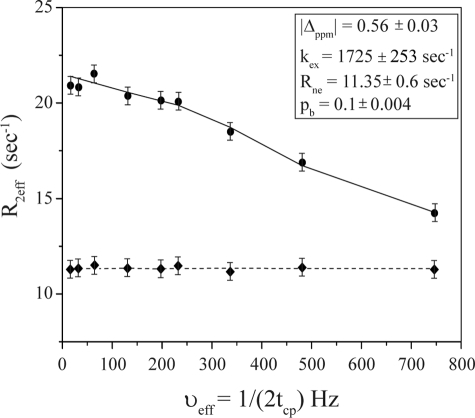
CPMG relaxation dispersion experiments are useful to determine millisecond to microsecond dynamics of 15N-labeled proteins utilizing 1H-15N heteronuclear single quantum coherence correlations (48, 49). Recent studies on transient binding of peptide ligands with the target proteins demonstrated that the kinetic parameters of the exchange processes can be extracted from relaxation dispersion measurements (52, 60). To understand the dynamics of Pa4 in the context of LPS binding, CPMG relaxation dispersion experiments were carried out on the complex at a Pa4:LPS molar ratio of 12:5:1. Fig. 4 shows relaxation dispersion profile of the 15N resonance of residue Leu-19 in the presence of LPS micelles. In the absence of LPS, Pa4 did not respond to the CMPG pulse trains showing no significant relaxation dispersion (Fig. 4). The dispersion data of the Pa4-LPS complex was fitted into a two-state exchange model (50) yielding the exchange rate (kex), the absolute value of the chemical shift difference (Δ ppm), and bound-state population (pb) (Fig. 4, inset). The data suggest that the rate of exchange of the complex to be fast (∼1725 s−1), typically suitable for tr-NOESY experiments (44, 45).
FIGURE 4.
Dynamics of Pa4 bound to LPS. The 15N relaxation dispersion profile of Pa4 [15N-Leu-19] in free solution (diamonds) and in the presence of LPS (circles) with a molar ratio of [LPS]:[pardaxin] = 1:12.5. The exchange rate (kex) of binding was obtained from two-dimensional 1H-15N relaxation dispersion measurements using the CPMG pulse sequence. Error bars represent the standard deviations, estimated from the duplicate relaxation time points. The experiments were performed at 700 MHz and 288 K.
Analysis of tr-NOESY Spectra
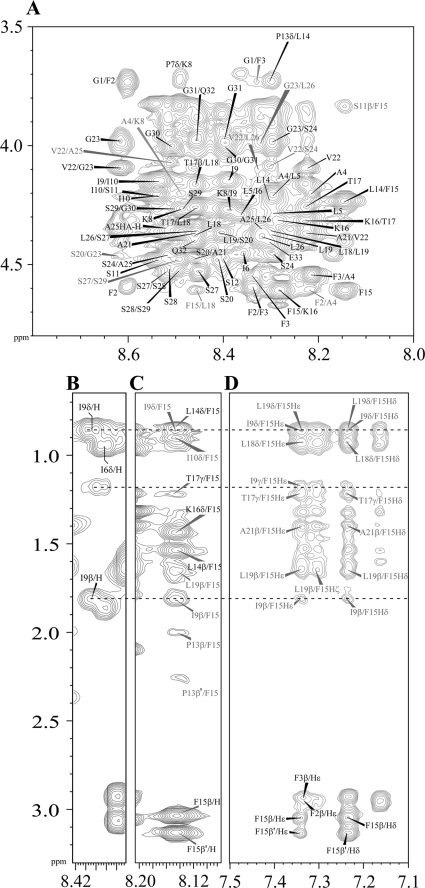
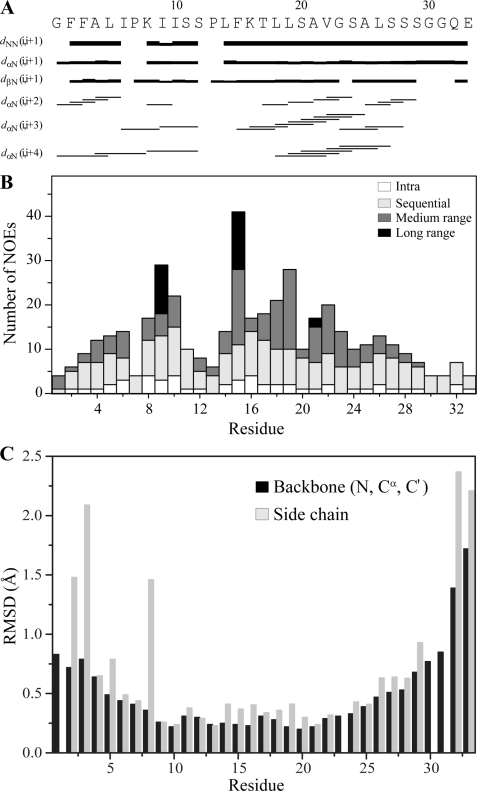
tr-NOESY is a useful tool to determine three-dimensional structures of ligands bound to the macromolecules (45). LPS forms high molecular weight micelles at low concentrations (≤0.1 μm) (51, 61), permitting observation of tr-NOEs from the bound peptides with a dissociation constant (Kd) in the micromolar to millimolar range (63–66). Fig. 5 shows the two-dimensional 1H-1H tr-NOESY spectra of Pa4, correlating fingerprint and aromatic regions in the presence of 40 μm LPS. By contrast to the NOESY spectra of Pa4 in free solution (supplemental Fig. S2A), there was a dramatic improvement, in terms of number and intensity of NOE cross-peaks, in the NOESY spectrum of Pa4 in complex with LPS micelles. In addition to the backbone αN (i,i+1) and sequential NN (i,i+1) tr-NOEs of Pa4 in LPS, a large number of medium range αN (i,i+3/i+4) tr-NOEs was detected, indicating a helical structure (Fig. 5A). Medium range NOEs were unambiguously identified for residues Ala4–Ser12 and Phe15–Ser28 (Fig. 6A). Based on the tr-NOEs alone, two helical segments (helix 1, Ala4–Ser12; helix 2, Phe15–Ser29) could be qualitatively assigned for Pa4 in LPS micelles. The peptide bonds between residues Ile6 and Pro7 and residues Ser12 and Pro13 adopt only a trans configuration as judged by the strong tr-NOEs between Ile6CαH-Pro7CδHs and Ser12CαH-Pro13CδHs, respectively. The chemical shifts of the aromatic ring protons and the amide proton of Phe15 are well separated from residues Phe2 and Phe3 (Fig. 5 and supplemental Table S1). There were a number of unambiguous long range tr-NOE contacts involving aromatic ring protons of Phe15 with CβH3 of residue Ala21 and also with the side-chain CγH2/CδH3 groups of Ile9 (Fig. 5, B–D). The aromatic ring protons of Phe15 also showed an ample number of medium range tr-NOEs with the CγH2 of Pro13, CβHs of Leu19, CγH3 of T17 and CδHs of Leu18 and Leu19 (Figs. 5D and 6A). By contrast, the aromatic ring protons of Phe2 and Phe3 appeared to be lacking any medium or long range NOE contacts in the Pa4-LPS complex. These data suggest that residue Phe15 is engaged by a large number of NOE contacts, ≥40 NOEs, with the neighboring residues in complex with LPS (Fig. 6B).
FIGURE 5.
Two-dimensional 1H-1H tr-NOESY spectra of Pa4 in LPS. A, the finger print region of the tr-NOESY spectra of Pa4 showing sequential and some medium range NOEs involving CαH and HN resonances. C and D, long range NOEs between the amide proton (C) and aromatic ring protons (D) of residue Phe15 with residues Ile9, Ile19, and Ala21. B, spin system identification of residue Ile9 of Pa4 in 1H-1H two-dimensional TOCSY spectrum. The tr-NOESY spectra of Pa4 were acquired in the presence of 40 μm LPS. tr-NOESY experiments were carried out at 600 MHz and 288 K, with a mixing time of 150 ms.
FIGURE 6.
A summary of NMR structural parameters of Pa4 in LPS micelle. A, a bar diagram showing sequential and medium range NOEs of Pa4 in the presence of LPS. The length of the bars indicates the intensity of the peaks, which are assigned as strong, medium, and weak. Amino acid sequence of Pa4 is shown at the top. B, a histogram showing the number of tr-NOEs of Pa4 as a function of residue number in complex with LPS micelles. C, root mean square deviations (RMSD) of backbone and side-chain atoms as a function of residue number of Pa4 for the twenty lowest energy conformers.
Three-dimensional Structure of Pa4 Bound to LPS
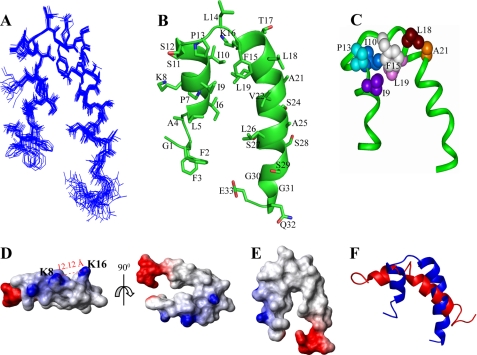
An ensemble of conformations of Pa4 in complex with LPS micelles was determined based on 242 distance constraints derived from 104 sequential, 72 medium range, and 16 long range tr-NOEs (Table 2). Fig. 6C delineates root mean square deviation (r.m.s.d.) for each residue. The LPS-bound structure of Pa4 is well defined with an average backbone and heavy atoms r.m.s.d. of 0.6 and 1.0 Å, respectively (Table 2). At the individual residue level, residues Leu5–Ala25 of Pa4 demonstrate the lowest r.m.s.d. values for the backbone and side-chain atoms (Fig. 6C). By contrast, residues Ala4–Lys8 and Leu26–Gly30 are characterized by a rather relatively higher r.m.s.d. both for the backbone and side-chain atoms (Fig. 6C). Fig. 7A shows superposition of all backbone atoms (Cα, N and C′) of the 20 lowest energy structures of Pa4. A close superposition can be seen for the backbone and side-chain atoms encompassing the central region of the peptide, especially for the residues Ala4–Ser29, except for Lys8 (Fig. 7A). However, both the termini of Pa4, e.g. residues Gly1–Phe3 and Gly30–Glu33, appear to be experiencing somewhat a larger conformational space (Fig. 7A). Fig. 7B represents the disposition of backbone topology and side-chain orientation of a selected structure of Pa4 bound to LPS. The LPS-induced conformation of Pa4 is defined by a short helix at the N-terminal (residues Leu5–Ser12) and a comparatively longer helix at the C-terminal (residues Lys16–Ser28), connected by a short loop consisted by residues Pro13, Leu14, and Phe15 (Fig. 7B). Other residues, Phe2–Ala4 and Ser29–Glu33, of Pa4 are found to be assuming extended conformations in LPS micelles (Fig. 7B). The N and C termini helices of Pa4 assume a define orientation dictated by the aromatic residue Phe15 from the loop, giving rise to a helix-loop-helix or helical hairpin structure (Fig. 7B). The longer C-terminal helix shows an approximate tilt, moved toward the shorter helix, of 25° from the helical axis.
TABLE 2.
A summary of structural statistics for the twenty final structures of Pa4 bound to LPS micelles
| Distance restraints | |
| Intra-residue (|i − j| = 0) | 50 |
| Sequential (|i − j| = 1) | 104 |
| Medium range (2 ≤ |i − j| ≤ 4) | 72 |
| Long range (|i − j| ≥ 5) | 16 |
| Total | 242 |
| Angular restraints (φ) | 29 |
| Distance restraints violations (Å)≤ | |
| Average violations | ≤0.21 |
| Maximum violations | ≤0.39 |
| Deviation from mean structure | |
| All residues (N, Cα, and C′) | 0.62 |
| Heavy atoms | 1.06 |
| Ramachandran plot for the mean structurea | |
| % residues in the most favorable and additionally allowed region | 100 |
| % residues in the generously allowed region | 0 |
| % residues in the disallowed region | 0 |
a Based on Procheck-NMR.
FIGURE 7.
Three-dimensional structure of Pa4 in LPS micelles. A, superposition of backbone atoms (N, Cα, and C′) of the twenty lowest energy structures of Pa4 bound to LPS, obtained from DYANA 1.5. B, a representative conformation of LPS-bound Pa4, showing side-chain orientation and backbone topology. This figure was produced using PyMOL. C, a space-filling representation of the side-chain to side-chain contacts of Pa4, involving residues Ile9, Ile10, Pro13, Phe15, Leu18, Leu19, and Ala21, in complex with LPS. The figure was prepared using InsightII. D and E, electrostatic surface potential of Pa4 structure in LPS micelles in two different orientations. The dotted line indicates the distance between ammonium groups of Lys8 and Lys16 residues. F, superposition of the LPS-bound structure (in blue ribbon) and the DPC-bound structure (in red ribbon) of Pa4. These images were produced using MOLMOL software.
The hydrophobic face of the N-terminal helix is maintained by the residues Leu5, Ile6, Ile9, and Ile10, whereas residues Lys8, Ser11, and Ser12 are positioned at the opposite hydrophilic face of Pa4 (Fig. 7B). In the longer helix, residues Leu19, Val22, and Leu26 are located in the non-polar face, whereas residues Thr17, Ser24, Ser28, and Ser29 are in the polar region (Fig. 7B). However, the polar or hydrophilic face of the C-terminal helix is interrupted by the presence of non-polar residues Leu18, Ala21, and Ala25 (Fig. 7B). The aromatic residue Phe15, from the intervening loop, plays an important role in bringing the non-polar faces of two helices, consisting of residues Ile9, Ile10, Pro13, Leu18, Leu19, and Ala21, to form a hydrophobic core (Fig. 7C). Interestingly, this structural arrangement appears to place the two positively charged residues (Lys8 and Lys16) across the two helices maintaining a distance of ∼13 Å (Fig. 7D). This distance separation is compatible with the inter-phosphate distance of lipid A moiety of LPS (see below). The LPS-induced structure of Pa4 essentially demonstrates a “horseshoe”-type fold (Fig. 7E). A substantial part of the horseshoe, including the “head or bend” is non-polar, sustained by residues Phe2, Phe3, Leu5, Ile6, Ile9, Ile10, Pro13, Phe15, Leu19, Val22, and Leu26 (Fig. 7E). The end regions of the two arms of the horseshoe are maintained by oppositely charged residues (Fig. 7E). The LPS-bound structure of Pa4 shows striking differences with the structure obtained in DPC micelles (Fig. 7F) (see below).
Interactions between Pa4 and LPS by STD NMR
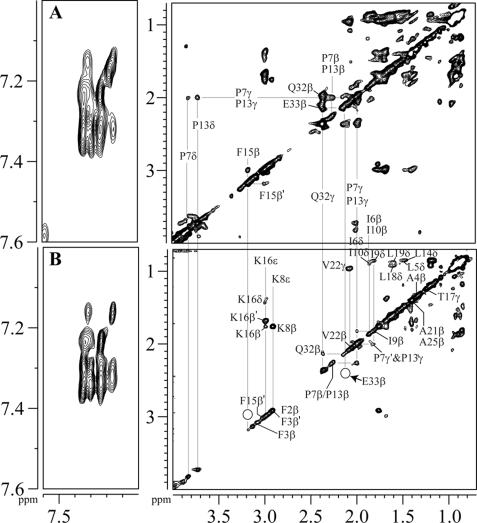
To understand the localization of Pa4 in LPS micelles, STD NMR experiments were performed. We have carried out one-dimensional STD and two-dimensional STD-TOCSY to examine the interacting residues of Pa4 with LPS. Overall, the one-dimensional STD spectra show aromatic ring protons, and a number of aliphatic side-chain proton resonances are in direct contact with LPS micelles (data not shown). The two-dimensional STD-TOCSY spectra are of high resolution facilitating unambiguous identification of LPS-binding residues (Fig. 8). Fig. 8 (A and B) shows off-resonance (or reference) TOCSY spectra and corresponding STD-TOCSY spectra of Pa4 in LPS, respectively, for the downfield-shifted aromatic ring protons (left panels) and upfield-shifted aliphatic side-chain proton resonances (right panels). STD-TOCSY spectra are interpreted following a previous study (47), whereby resonances showing cross-peaks in the STD-TOCSY spectra are considered to be strongly saturated owing to their close contacts, ≤5 Å, with macromolecules. As can be seen, the ring proton resonances of Phe2, Phe3, and Phe15 residues of Pa4 delineate intense STD effects, indicating their close contacts with LPS (Fig. 8B, left panel). The two β-proton resonances of Phe15 are non-degenerate, resonating at 3.13 and 3.04 ppm, showing TOCSY correlations in the off-resonance spectrum (Fig. 8A, right panel). However, in the STD-TOCSY spectra, there are no correlations for the β-proton resonances of Phe15 (Fig. 8B, left panel), suggesting these protons are not in close proximity with LPS micelles and, hence, had received less or a low degree of saturations. Similarly, a low degree of saturations or lack of contact with LPS were observed for the CδHs of Pro7 and Pro13 and C-terminal residues Gln32 and Glu33 of Pa4 (Fig. 8, A and B). On the other hand, strong STD effects were detected for the side-chain resonances of non-polar residues Leu5, Ile6, Ile9, Ile10, Leu14, Leu18, and Val22, indicating their close proximity to LPS micelles (Fig. 8B, left panel). Most importantly, two-dimensional STD (Fig. 8B, right panel) spectra clearly show the cross-peaks from the side chains (CβHs, CδHs, and CϵHs) of two basic residues Lys8 and Lys16, establishing their direct contacts with LPS. Taken together, STD-TOCSY data demonstrate critical residues, including aromatic, aliphatic, and two cationic, that are in close contact with LPS micelles.
FIGURE 8.
Localization of Pa4 in LPS micelles by STD NMR. A, the reference or off-resonance TOCSY spectrum and (B) STD TOCSY spectrum of Pa4 in the presence of LPS in D2O at pH 4.5 and 288 K, showing the downfield-shifted aromatic resonances (left panels) and upfield-shifted side-chain resonances (right panels). Spectra were acquired using spin-lock MLEV17 sequence with a mixing time of 80 ms. Saturation of LPS was achieved by applying a cascade of 40 Gaussian pulses (50 ms each), resulting in a total saturation of ∼2 s (on-resonance, −2.0 ppm; off-resonance, 40 ppm).
Perturbation of LPS Micelles by Pa4
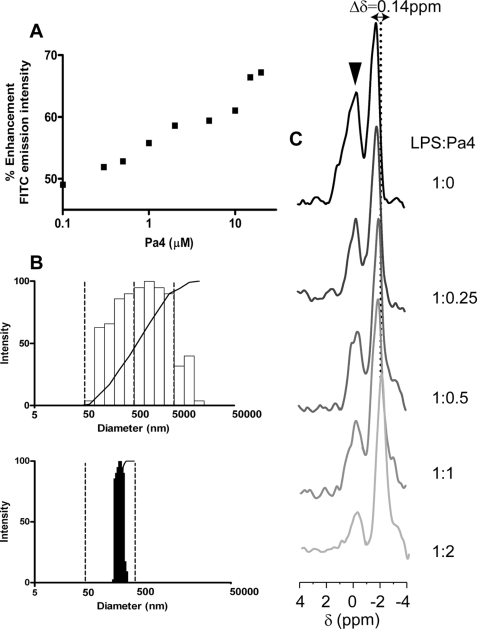
We have probed plausible structural changes of LPS micelles upon binding to Pa4 using three different methods, namely FITC fluorescence of FITC-conjugated LPS, dynamics light scattering, and 31P NMR experiments. Fluorescence intensity of FITC had been found to be sensitive to the aggregation states of FITC-LPS (67). A quenched fluorescence intensity of FITC-LPS could be observed in the absence of Pa4 (Fig. 9A). However, the binding of Pa4 to LPS has caused an enhancement of fluorescence intensity of FITC (Fig. 9A). A 5-fold increase in the fluorescence intensities of FITC has been observed upon additions of Pa4 from nanomolar (100 nm) to micromolar (25 μm) concentrations. This dequenching effect results from the dissociation of LPS aggregates, indicating destabilization of LPS assembly. Several host defense AMPs, including magainin and human cathelicidin LL37, had demonstrated a similar effect on the LPS structure (18, 68). The effect of Pa4 on the apparent size distribution of LPS micelles was determined by DLS using photon correlation spectroscopy at a scattering angle of 90°. Fig. 9B shows particle size analysis of LPS aggregates in the absence (upper panel) and in the presence of Pa4 (lower panel). The hydrodynamic diameter of LPS aggregates is shown along the x-axis. The vertical bars represent the relative percentage of the LPS particle size distribution, with the larger aggregates having a normalized frequency of 100. As can be seen, in the presence of Pa4, high molecular weight clusters of LPS aggregates with a diameter of >500 nm are completely absent. In addition, the polydispersity of LPS aggregates with a diameter centered at ∼1347 nm were shifted with concomitant 80% decrease in mean hydrodynamic diameter of LPS to 271 nm in the presence of Pa4. This observation once again explains the dissociation of LPS micelles into smaller sizes upon interactions with Pa4.
FIGURE 9.
Disaggregation of LPS by Pa4. A, FITC-LPS disaggregation by Pa4 using fluorescence spectroscopy. The fluorescence intensity of FITC increases as a function of increasing concentrations (0.1–15 μm) of Pa4 peptide. Fluorescence studies were performed in 10 mm sodium phosphate buffer, pH 6.0, at 298 K. B, particle size measurements of LPS in free and in the presence of Pa4 from quasi-elastic light scattering measurements. The average size of aggregates of LPS (top) was observed to decrease upon addition of Pa4 in a 1:2 molar ratio (bottom) in 10 mm sodium phosphate, pH 6.0, at 298 K. C, one-dimensional 31P NMR spectra of 0.2 mm LPS in the presence of different concentrations of Pa4, showing the changes of chemical shift (arrow) as well as the line broadening of 31P resonances (▼) of LPS. The NMR experiments were carried out in aqueous solutions, pH 4.5, on a Bruker DRX 400-MHz spectrometer, pH 4.5.
Binding of Pa4 with the phosphate head groups of LPS were further examined using 31P NMR experiments. The 31P NMR spectrum of LPS micelle is characterized by two well resolved resonances (Fig. 9C). By the comparison of 31P NMR spectra of LPS dissolved in SDS detergent micelle (66, 69), we assumed that the intense peak ∼−2.00 ppm corresponds to the diphosphate groups of LPS, and the downfield-shifted peak at ∼−0.72 ppm belongs to the monophosphate group of LPS, attached to the O4′ of GlcN I. There was a drastic change of 31P resonances of the LPS micelles upon additions of increasing concentrations of Pa4, as monitored by progressive chemical shift changes as well as broadening of 31P resonances (Fig. 9C). The 31P resonance of LPS at ∼−2.00 ppm was shifted significantly upfield in complex with Pa4. On the other hand, the 31P resonance of LPS at −0.72 ppm undergoes a significant broadening upon binding to Pa4 (Fig. 9C). Such line broadening of 31P resonances of LPS upon binding to Pa4 suggests that plausible conformational exchanges among the different states of LPS-peptide complexes. The upfield shift of the 31P resonance of LPS may occur due to a close proximity of the one or more Phe residues (Phe2, Phe3, and Phe15) of Pa4 with the head groups of LPS, as demonstrated by the STD experiments (Fig. 8). Taken together, these results (Fig. 9) confirm that the LPS micelles undergo structural rearrangements or a dissociation of larger LPS aggregates into small sizes in complex with Pa4.
IR Studies
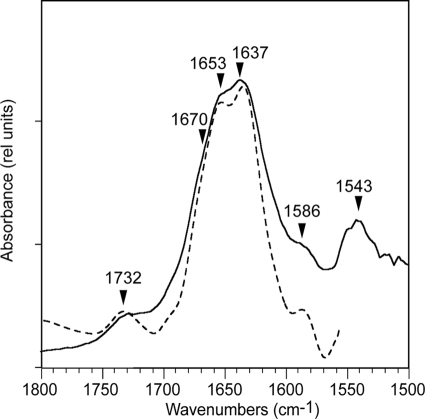
In the presence of hydrated LPS, Pa4 showed two main bands in the amide I region of the IR spectrum (Fig. 10, blue). These bands become more apparent after Fourier self-deconvolution and are centered at 1653 and 1637 cm−1. The first band is clearly assigned to α-helix, whereas the second band is usually assigned to β-structure, although it has also been assigned to the 310-helix (70). The amide I also has a shoulder at ∼1670 cm−1 that is usually assigned to turns (loop regions). The bands at 1732 and 1586 cm−1 probably correspond to a protonated and a deprotonated side chain of residue Glu33 (71), respectively. The band at 1543 cm−1 corresponds to the amide II band of the peptide, which therefore is at least partially protected from D2O exchange in these conditions. Although a quantitative estimate of the secondary structure is not possible, because the areas of the two main bands are not similar. The structural characterization of Pa4 in LPS micelles by IR is in good agreement with the NMR-derived structure showing the presence of helices, loop/turn, and extended conformations at the termini.
FIGURE 10.
Secondary structure of Pa4 in hydrated LPS (D2O) using Fourier transform IR. Original spectrum (solid lines) in the amide I and II regions corresponding to LPS:Pa4 in a 20:1 molar ratio after subtracting the contribution of LPS in bulk D2O, and deconvolved spectrum (broken lines).
DISCUSSION
Pardaxins are originally identified as pore-forming membrane lytic peptides (30, 31). Later on, antibacterial activities, against both Gram-negative and Gram-positive organisms, of pardaxins were discovered (33, 35). The antibacterial activities of pardaxins were found to be comparable or even higher than many other host defense AMPs like magainin, cecropins, and dermaseptins (35). Antibacterial activities of AMPs are often positively correlated with the net content of cationic residues in their amino acid sequences (5). Analysis of charge distribution in the AMPs had revealed average positive charges of +4 to +6 for the most potent AMPs (5). A high cationicity and amphipathic structure have been attributed to AMPs membrane interactions and cell lysis (1–3). In particular, a higher positive charge content has been thought to be necessary to overcome the LPS-mediated barrier in Gram-negative organisms (11–13). Recent studies with amphibian AMPs temporins demonstrated the role of LPS in preventing the outer membrane permeabilization by low cationic (+1 to +2) antimicrobial peptides (20, 21). Temporins A and B are largely inactive against Gram-negative bacteria as a result of the lack of their outer membrane permeabilization. However, an interesting synergistic effect has been demonstrated among these temporins to disrupt outer membranes (20, 21). The structural basis of the synergistic mechanism is not known. Although it has been demonstrated that single temporins might aggregate in the LPS layer, thus preventing transversal through the outer membrane (20, 21). In contrast to these, Pa4 contains a net positive charge of +1, disregarding terminal charges, and is found to be independently active. A considerably large body of work has been carried out for Pa4 and other members of the family in synthetic lipids of different compositions. However, no studies on pardaxins embedded in outer membranes or LPS have been reported. Taken into consideration temporin synergistic mechanisms, it becomes important to determine structural consequences of this particular class of AMPs in the outer membrane or LPS.
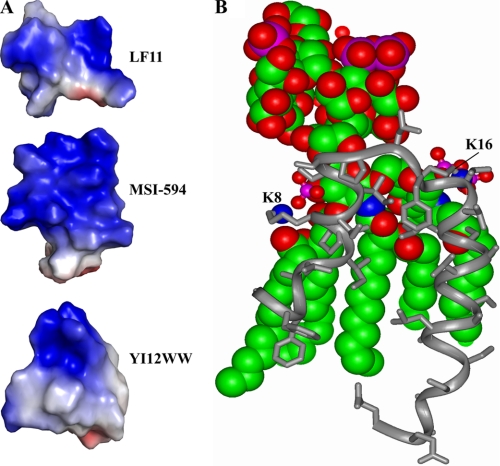
In this context, we have determined the atomic level resolution three-dimensional structure of Pa4 as a complex with LPS for the first time and studied its interactions with LPS by various methods. Pa4 induces uptake of NPN in a concentration-dependent manner, indicating its ability to disrupt the outer membrane barrier. Energetics of interactions between LPS and Pa4 were investigated at 298 K and 313 K, corresponding to the gel and liquid crystalline phases of LPS, respectively. The binding affinity or equilibrium association constant between Pa4 and LPS has been estimated to be very similar at both temperatures (Table 1). Pa4 binding to the gel phase of LPS is primarily driven by the positive change of entropy or hydrophobic interactions. At 313 K, enthalpy change appears to be slightly negative with positive entropy change contributing to the interactions. It is noteworthy that ITC studies on polycationic antimicrobial peptide polymyxins and low charged temporins showed very similar temperature-dependent binding behavior with LPS (21, 58). Taken together, these results suggest that Pa4 also interacts similarly with LPS. CD studies indicate that LPS-bound Pa4 acquires helical conformations, as demonstrated for pardaxins in lipid vesicles and membrane mimetic solvents (29, 33). tr-NOESY demonstrates a well defined structure of Pa4 in complex with LPS micelles. The tertiary fold, resembling a horseshoe, of Pa4 is determined by two helices, a short N-terminal helix and a longer C-terminal helix, connected by a tight turn. The aromatic ring of Phe15 from the turn acts as a pivot that interconnects the two helices by non-polar packing interactions. Few residues, Phe2–Ala4 and Ser29–Glu33 appear to be extended in LPS-bound conformation of Pa4. The horseshoe structure of Pa4 in LPS determined in this work can be considered as novel, because three-dimensional structures of AMPs determined to date either in LPS (64–66) or in synthetic lipid micelles (1, 5) do not resemble this conformation. Recently, we have determined a helical hairpin structure of a potent antimicrobial peptide MSI-594 in LPS micelles (72). Although MSI-594 adopts a helix-loop-helix structure in LPS, the topology of Pa4 and MSI-594 is largely different (Fig. 11A). A T-shaped conformation and boomerang-type folds were observed for an 11-residue antimicrobial fragment of protein lactoferrin (64) and de novo designed peptides (66), respectively, in complex with LPS (Fig. 11A).
FIGURE 11.
Surface topology of LPS-bound structures and model of Pa4-LPS complex. A, electrostatic potential surface of three antimicrobial peptides, LF11 (64), MSI-594 (72), and YI13WW (66) determined in LPS micelles. These images were produced using PyMOL. B, a molecular model of interactions between Pa4 and LPS. The model was generated using InsightII software.
The three-dimensional structures of Pa4 and Pa1 have been determined in DPC micelles and in 2,2,2-tifluoroethanol/water mixture, respectively (40, 41). Under these conditions, independently folded helical structures were stabilized with a kink at residue Pro13. The high resolution conformation of Pa4 determined by NMR in DPC micelles showed two helices at the N (residues 7–13) and C (residues 17–30) termini, with a bend at residue Pro13 (Fig. 7F) (40). Most importantly, the DPC-bound structure of Pa4 lacks any interhelical packing interactions as observed for the LPS-bound structure (Fig. 7F). Recent NMR studies of AMPs in LPS micelles demonstrated constellations of non-polar/aromatic residues defining compact structures (54, 64–66, 72). A more recent work on the designed β-sheet peptide conformations in LPS had delineated functional significances, in terms of antimicrobial and anti-endotoxic activities, of packing interaction (66). STD experiments indicate a close proximity of the three aromatic ring protons (Phe2, Phe3, and Phe15) and aliphatic side-chain protons with LPS micelles. It is interesting to note that, although the N-terminal aromatic residues Phe2 and Phe3 do not assume a folded structure in LPS, these residues are found to be in contacts with the micelles. The side chains of two cationic residues, Lys8 and Lys16, of Pa4 demonstrate strong STD effects for CβHs, CϵHs, and CδHs, indicating their localization at the LPS micelles. Pa4 appears to bring significant perturbations of LPS micelle organization. FITC fluorescence and DLS data demonstrate disaggregation of LPS micelles into smaller sizes. In addition, the 31P NMR resonances of LPS are highly affected upon additions of Pa4. The chemical shift perturbations as well as the line broadening effect of phosphate groups of LPS in the presence of Pa4 suggest that an increase is plausible in the dynamics at the phosphate head groups of LPS. Taken together, these results elucidate a disorderliness of the LPS micelle and dissociation of LPS aggregates into smaller size complexes in complex with Pa4. Interestingly, similar structural perturbations of the phosphate head groups of LPS were observed for a highly active magainin- and melittin-derived AMP MSI-594 (72) and designed peptides (66). Collectively, these results indicate that overall effects on LPS micelle structure of Pa4 are similar to other highly cationic AMPs.
The three-dimensional structure of Pa4 in LPS and its interactions presented in this work provide mechanistic insight(s) at the outer membrane. In the horseshoe-shaped structure of Pa4 obtained in LPS micelles two cationic residues Lys8 and Lys16 located at the middle of the N terminus helix and at the beginning of the C terminus helix can interact with the bis-phosphate groups of lipid A moiety of LPS via salt bridge or hydrogen bonding. The close proximity of these residues is deduced from the STD studies. The three-dimensional structure of Pa4 in LPS demonstrates that the two charged H3N+ groups of Lys8 and Lys16 are ∼12–13 Å apart. This distance is geometrically compatible with the inter-phosphate distance of the phosphate groups of lipid A domain of LPS. Hydrophilic residues, e.g. Ser11 and Ser12 from the N-terminal helix, located at the same helical face of residue Lys8 and residue Thr17 from the C-terminal helix may complement the phosphate head group interactions by forming additional hydrogen bonds with the sugar moieties of LPS. In other words, this mode of binding of Pa4 to LPS may orient two of its helices providing facile contacts with the hydrophobic residues along the acyl chains of LPS (Fig. 11B). These interactions between Pa4 and LPS may lead to a plausible disruption or fluidization of LPS structures facilitating traversal of the peptide through the outer membrane. The compact structure of Pa4 will certainly aid in the process of permeation. The mode of LPS recognition by Pa4 has also partly been supported by functional and vesicle binding studies, whereby replacements of charged residues Lys8/Lys16 or the aromatic residue Phe15 had significantly reduced membrane interactions and antibacterial activities (32, 33).
Although our NMR studies have provided atomic level insights into the outer membrane permeation of pardaxin, it may be pointed out that the LPS micelles lack the contributions from other components of the bacterial outer membrane and the related constrained, planar surface of the membrane. In this context, the development of more physiologically relevant model membranes to closely mimic the bacterial outer membrane particularly for high resolution NMR studies could be valuable. Such model membranes are bound to be immobile in the NMR timescale and therefore could be utilized to understand the role of individual components on the function of antimicrobial peptides using solid state NMR experiments (73, 74). It is also worth mentioning that pardaxins have been demonstrated to form pores in the model lipid vesicles or liposome (28, 29). Such pore formation may require oligomerization of pardaxins in the lipid membranes. The LPS-bound structure of Pa4 determined here does not appear to show any detectable inter-peptide interactions as judged by the paucity of inter-peptide NOEs. Therefore, Pa4 may be active as a monomeric form in the outer membrane lipid like LPS as described for other highly active AMPs (66, 72). Recent biophysical studies had also demonstrated that oligomerization of AMPs in LPS caused a reduction of antimicrobial activities (18–21). However, self-association of pardaxins in the outer membrane or LPS cannot be completely ruled out, because membrane perturbations by AMPs have been proposed to occur using multistep mechanisms (1–3).
In conclusion, we have solved a unique three-dimensional structure of a naturally occurring cell lytic peptide Pa4 in complex with LPS micelles. Although this is the first structure of Pa4 in the presence of LPS, it is interesting to note that that this represents the LPS-bound structure of a longest bactericidal peptide determined thus far. Current study identifies critical structural features of Pa4 for LPS recognition and provides a plausible mechanism of the outer membrane disruption. We believe that the LPS-bound structure of Pa4 and other finding in this study will be useful in the development of new antimicrobials with enhanced binding affinity for LPS (62, 75).
Supplementary Material
Acknowledgments
We thank Dr. Helena Kovacs (Bruker Biospin AG, Switzerland) for important discussion and suggestions regarding CPMG experiments and K. Janarthan for writing the C-program to fit the CPMG data. A. B. thanks Edward Tan for help with figures.
This work was supported, in whole or in part, by National Institutes of Health Grant AI 054515 (to A. R.). This work was also supported by Grant 06/1/22/19/446 from A*Star Biomedical Research Council Singapore (to S. B.).
The atomic coordinates and structure factors (code 2kns) have been deposited in the Protein Data Bank, Research Collaboratory for Structural Bioinformatics, Rutgers University, New Brunswick, NJ (http://www.rcsb.org/).

The on-line version of this article (available at http://www.jbc.org) contains supplemental Figs. S1 and S2 and Table S1.
T. D. Goddard and D. G. Kneller, University of California, San Francisco.
- AMP
- antimicrobial peptide
- tr-NOE
- transferred nuclear Overhauser effect
- NOESY
- nuclear Overhauser effect spectroscopy
- TOCSY
- total correlation spectroscopy
- NOE
- nuclear Overhauser enhancement
- LPS
- lipopolysaccharide
- STD
- saturation transfer difference
- CPMG
- Carr-Purcell-Meiboom-Gill
- ITC
- isothermal titration calorimetry
- DLS
- dynamic light scattering
- FITC
- fluorescein isothiocyanate
- NPN
- 1-N-phenylnaphthylamine
- DPC
- dodecyl phosphocholine.
REFERENCES
- 1.Zasloff M. (2002) Nature 415, 389–395 [DOI] [PubMed] [Google Scholar]
- 2.Brogden K. A. (2005) Nat. Rev. Microbiol. 3, 238–250 [DOI] [PubMed] [Google Scholar]
- 3.Boman H. G. (1995) Annu. Rev. Immunol. 13, 61–92 [DOI] [PubMed] [Google Scholar]
- 4.Hancock R. E., Sahl H. G. (2006) Nat. Biotech. 24, 1551–1557 [DOI] [PubMed] [Google Scholar]
- 5.Tossi A., Sandri L., Giangaspero A. (2000) Biopolymers 55, 4–30 [DOI] [PubMed] [Google Scholar]
- 6.Kondejewski L. H., Jelokhani-Niaraki M., Farmer S. W., Lix B., Kay C. M., Sykes B. D., Hancock R. E., Hodges R. S. (1999) J. Biol. Chem. 274, 13181–13192 [DOI] [PubMed] [Google Scholar]
- 7.Hancock R. E., Lehrer R. (1998) Trends Biotechnol. 16, 82–88 [DOI] [PubMed] [Google Scholar]
- 8.Fischbach M. A., Walsh C. T. (2009) Science 325, 1089–1093 [DOI] [PMC free article] [PubMed] [Google Scholar]
- 9.Raetz C. R., Whitfield C. (2002) Annu. Rev. Biochem. 71, 635–700 [DOI] [PMC free article] [PubMed] [Google Scholar]
- 10.Nikaido H. (1994) Science 264, 382–388 [DOI] [PubMed] [Google Scholar]
- 11.Hancock R. E. (1997) Trends Microbiol. 5, 37–42 [DOI] [PubMed] [Google Scholar]
- 12.Allende D., McIntosh T. J. (2003) Biochemistry 42, 1101–1108 [DOI] [PubMed] [Google Scholar]
- 13.Snyder D. S., McIntosh T. J. (2000) Biochemistry 39, 11777–11787 [DOI] [PubMed] [Google Scholar]
- 14.Loutet S. A., Flannagan R. S., Kooi C., Sokol P. A., Valvano M. A. (2006) J. Bacteriol. 188, 2073–2080 [DOI] [PMC free article] [PubMed] [Google Scholar]
- 15.Ortega X., Silipo A., Saldías M. S., Bates C. C., Molinaro A., Valvano M. A. (2009) J. Biol. Chem. 284, 21738–21751 [DOI] [PMC free article] [PubMed] [Google Scholar]
- 16.Gunn J. S. (2001) J. Endotoxin Res. 7, 57–62 [PubMed] [Google Scholar]
- 17.Guo L., Lim K. B., Poduje C. M., Daniel M., Gunn J. S., Hackett M., Miller S. I. (1998) Cell 95, 189–198 [DOI] [PubMed] [Google Scholar]
- 18.Rosenfeld Y., Papo N., Shai Y. (2006) J. Biol. Chem. 281, 1636–1643 [DOI] [PubMed] [Google Scholar]
- 19.Papo N., Shai Y. (2005) J. Biol. Chem. 280, 10378–10387 [DOI] [PubMed] [Google Scholar]
- 20.Rosenfeld Y., Barra D., Simmaco M., Shai Y., Mangoni M. L. (2006) J. Biol. Chem. 281, 28565–28574 [DOI] [PubMed] [Google Scholar]
- 21.Mangoni M. L., Epand R. F., Rosenfeld Y., Peleg A., Barra D., Epand R. M., Shai Y. (2008) J. Biol. Chem. 283, 22907–22917 [DOI] [PubMed] [Google Scholar]
- 22.Cohen J. (2002) Nature 420, 885–891 [DOI] [PubMed] [Google Scholar]
- 23.Angus D. C., Wax R. S. (2001) Crit. Care Med. 29, S109–S116 [DOI] [PubMed] [Google Scholar]
- 24.Hancock R. E., Diamond G. (2000) Trends Microbiol. 8, 402–410 [DOI] [PubMed] [Google Scholar]
- 25.Scott M. G., Davidson D. J., Gold M. R., Bowdish D., Hancock R. E. (2002) J. Immunol. 169, 3883–3891 [DOI] [PubMed] [Google Scholar]
- 26.Shai Y., Fox J., Caratsch C., Shih Y. L., Edwards C., Lazarovici P. (1988) FEBS Lett. 242, 161–166 [DOI] [PubMed] [Google Scholar]
- 27.Thompson S. A., Tachibana K., Nakanishi K., Kubota I. (1986) Science 233, 341–343 [DOI] [PubMed] [Google Scholar]
- 28.Rapaport D., Shai Y. (1991) J. Biol. Chem. 266, 23769–23775 [PubMed] [Google Scholar]
- 29.Rapaport D., Shai Y. (1992) J. Biol. Chem. 267, 6502–6509 [PubMed] [Google Scholar]
- 30.Lazarovici P. (1992) J. Natural Toxins 1, 1–15 [Google Scholar]
- 31.Shai Y. (1994) Toxicology 87, 109–129 [DOI] [PubMed] [Google Scholar]
- 32.Shai Y., Bach D., Yanovsky A. (1990) J. Biol. Chem. 265, 20202–20209 [PubMed] [Google Scholar]
- 33.Saberwal G., Nagaraj R. (1993) J. Biol. Chem. 268, 14081–14089 [PubMed] [Google Scholar]
- 34.Shai Y., Hadari Y. R., Finkels A. (1991) J. Biol. Chem. 266, 22346–22354 [PubMed] [Google Scholar]
- 35.Oren Z., Shai Y. (1996) Eur. J. Biochem. 237, 303–310 [DOI] [PubMed] [Google Scholar]
- 36.Shai Y., Oren Z. (1996) J. Biol. Chem. 271, 7305–7308 [DOI] [PubMed] [Google Scholar]
- 37.Thennarasu S., Nagaraj R. (1996) Protein Eng. 9, 1219–1224 [DOI] [PubMed] [Google Scholar]
- 38.Hallock K. J., Lee D. K., Omnaas J., Mosberg H. I., Ramamoorthy A. (2002) Biophys. J. 83, 1004–1013 [DOI] [PMC free article] [PubMed] [Google Scholar]
- 39.Hallock K. J., Wildman K., Lee D. K., Ramamoorthy A. (2002) Biophys. J. 82, 2499–2503 [DOI] [PMC free article] [PubMed] [Google Scholar]
- 40.Porcelli F., Buck B., Lee D. K., Hallock K. J., Ramamoorthy A., Veglia G. (2004) J. Biol. Chem. 279, 45815–45823 [DOI] [PMC free article] [PubMed] [Google Scholar]
- 41.Zagorski M. G., Norman D. G., Barrow C. J., Iwashita T., Tachibana K., Patel D. J. (1991) Biochemistry 30, 8009–8017 [DOI] [PubMed] [Google Scholar]
- 42.Ramamoorthy A., Wei Y., Lee D. K. (2004) Annu. Rep. NMR Spectrosc. 52, 2–52 [Google Scholar]
- 43.Ramamoorthy A., Lee D. K., Narasimhaswamy T., Nanga R. P. (2009) Biochim. Biophys. Acta, in press [DOI] [PMC free article] [PubMed] [Google Scholar]
- 44.Clore G. M., Gronenborn A. M. (1982) J. Magn. Reson. 48, 402–417 [Google Scholar]
- 45.Post C. B. (2003) Curr. Opin. Struct. Biol. 13, 581–588 [DOI] [PubMed] [Google Scholar]
- 46.Mayer M., Meyer B. (1999) Angew. Chem. Int. Ed. Engl. 38, 1784–1788 [DOI] [PubMed] [Google Scholar]
- 47.Haselhorst T., Weimer T., Peters T. (2001) J. Am. Chem. Soc. 123, 10705–10714 [DOI] [PubMed] [Google Scholar]
- 48.Palmer A. G., 3rd, Kroenke C. D., Loria J. P. (2001) Methods Enzymol. 339, 204–238 [DOI] [PubMed] [Google Scholar]
- 49.Korzhnev D. M., Kay L. E. (2008) Acc. Chem. Res. 41, 442–451 [DOI] [PubMed] [Google Scholar]
- 50.Loh B., Grant C., Hancock R. E. (1984) Antimicrob. Agents Chemother. 26, 546–551 [DOI] [PMC free article] [PubMed] [Google Scholar]
- 51.Yu L., Tan M., Ho B., Ding J. L., Wohland T. (2006) Anal. Chim. Acta 556, 216–225 [DOI] [PubMed] [Google Scholar]
- 52.Zintsmaster J. S., Wilson B. D., Peng J. W. (2008) J. Am. Chem. Soc. 130, 14060–14061 [DOI] [PMC free article] [PubMed] [Google Scholar]
- 53.Güntert P., Mumenthaler C., Wüthrich K. (1997) J. Mol. Biol. 273, 283–298 [DOI] [PubMed] [Google Scholar]
- 54.Bhattacharjya S., Domadia P. N., Bhunia A., Malladi S., David S. A. (2007) Biochemistry 46, 5864–5874 [DOI] [PubMed] [Google Scholar]
- 55.Byler D. M., Susi H. (1986) Biopolymers 25, 469–487 [DOI] [PubMed] [Google Scholar]
- 56.Marsh D. (1999) Biophys. J. 77, 2630–2637 [DOI] [PMC free article] [PubMed] [Google Scholar]
- 57.Thomas C. J., Surolia N., Surolia A. (2001) J. Biol. Chem. 276, 35701–35706 [DOI] [PubMed] [Google Scholar]
- 58.Howe J., Andrä J., Conde R., Iriarte M., Garidel P., Koch M. H., Gutsmann T., Moriyón I., Brandenburg K. (2007) Biophys. J. 92, 2796–2805 [DOI] [PMC free article] [PubMed] [Google Scholar]
- 59.Wüthrich K. (1986) NMR of Protein and Nucleic Acids, John Wiley & Sons, New York [Google Scholar]
- 60.Tolkatchev D., Xu P., Ni F. (2003) J. Am. Chem. Soc. 125, 12432–12442 [DOI] [PubMed] [Google Scholar]
- 61.Santos N. C., Silva A. C., Castanho M. A., Martins-Silva J., Saldanha C. (2003) Chembiochem 4, 96–100 [DOI] [PubMed] [Google Scholar]
- 62.Dürr U. H., Sudheendra U. S., Ramamoorthy A. (2006) Biochim. Biophys. Acta 1758, 1408–1425 [DOI] [PubMed] [Google Scholar]
- 63.Bhattacharjya S., David S. A., Mathan V. I., Balaram P. (1997) Biopolymers 41, 251–265 [Google Scholar]
- 64.Japelj B., Pristovsek P., Majerle A., Jerala R. (2005) J. Biol. Chem. 280, 16955–16961 [DOI] [PubMed] [Google Scholar]
- 65.Bhunia A., Chua G. L., Domadia P. N., Warshakoon H., Cromer J. R., David S. A., Bhattacharjya S. (2008) Biochem. Biophys. Res. Commun. 369, 853–857 [DOI] [PubMed] [Google Scholar]
- 66.Bhunia A., Mohanram H., Domadia P. N., Torres J., Bhattacharjya S. (2009), J. Biol. Chem. 284, 21991–22004 [DOI] [PMC free article] [PubMed] [Google Scholar]
- 67.Tobias P. S., Soldau K., Gegner J. A., Mintz D., Ulevitch R. J. (1995) J. Biol. Chem. 270, 10482–10488 [DOI] [PubMed] [Google Scholar]
- 68.Rosenfeld Y., Sahl H. G., Shai Y. (2008) Biochemistry 47, 6468–6478 [DOI] [PubMed] [Google Scholar]
- 69.Strain S. M., Fesik S. W., Armitage I. M. (1983) J. Biol. Chem. 258, 13466–13477 [PubMed] [Google Scholar]
- 70.Holloway P. W., Mantsch H. H. (1989) Biochemistry 28, 931–935 [DOI] [PubMed] [Google Scholar]
- 71.Venyaminov S., Kalnin N. N. (1990) Biopolymers 30, 1243–1257 [DOI] [PubMed] [Google Scholar]
- 72.Bhunia A., Ramamoorthy A., Bhattacharjya S. (2009) Chemistry 15, 2036–2040 [DOI] [PubMed] [Google Scholar]
- 73.Ramamoorthy A. (2009) Solid State NMR Spectrosc. 35, 201–207 [DOI] [PMC free article] [PubMed] [Google Scholar]
- 74.Bhattacharjya S., Ramamoorthy A. (2009) FEBS J. 276, 6465–6473 [DOI] [PubMed] [Google Scholar]
- 75.Ramamoorthy A., Thennarasu S., Tan A., Gottipati K., Sreekumar S., Heyl D. L., An F. Y., Shelburne C. E. (2006) Biochemistry 45, 6529–6540 [DOI] [PMC free article] [PubMed] [Google Scholar]
Associated Data
This section collects any data citations, data availability statements, or supplementary materials included in this article.


