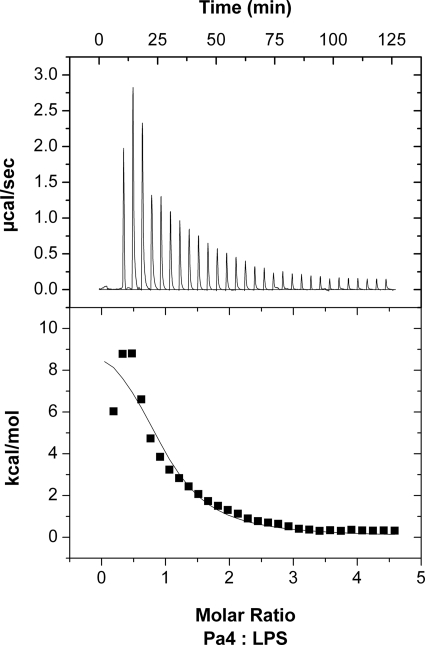
FIGURE 3.
Binding energetic for Pa4-LPS interaction by ITC. Calorimetric trace of 1 mm Pa4 titrated into 0.05 mm E. coli LPS 0111:B4 in 10 mm sodium phosphate, pH 6.2, is shown at 298 K. The upper panel shows the titrated peaks plotted as power (microcalories s−1) against time (minutes). The lower panel shows the corresponding integrated heat levels of binding.

