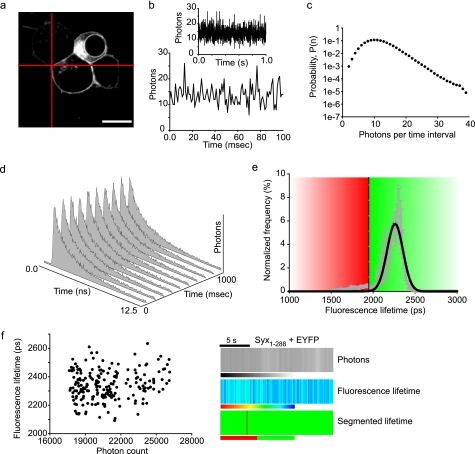
FIGURE 3.
Dynamic syntaxin/Munc18 interactions at the plasma membrane (16). Targeting the laser excitation beam on the plasma membrane (a) allows the fast streaming of TCSPC data from a single point. b, photon fluctuations are shown, with an expanded time scale in the lower graph. c, the photon fluctuations contain a non-random signal as evidenced by the non-Poisson distribution. d, the TCSPC data can be fit by an exponential decay for each time sample, and the time constant of the fluorescence decays can be calculated: in this case, decay curves were acquired every 100 ms. e, to allow segmentation of the lifetimes into intervals where interacting (red) or non-interacting (green) conditions predominate, TCSPC-FLIM data from a cell expressing mCer-syntaxin and unfused dkEYFP (as a control for the non-FRET condition) was plotted on a histogram. The distribution of lifetimes was fit by a single Gaussian and the lower 99.9% confidence interval of the distribution used to segment the data (threshold at 1,950 ps). f, the measured fluorescence lifetime exhibited no correlation with the fluorescence intensity (photon count, left panel), highlighting the independence of these two properties of the fluorophores. Presentation of fluorescence intensity, fluorescence lifetime, and segmented lifetime (using the threshold defined in e) in a human understandable format (right panel). Scales are: intensity, grayscale from 0 to 30,000 photons; fluorescence lifetime, color scale from 1,000 ps (red) to 2,500 ps (blue); segmented lifetime, binary scale (red, interacting; green, not interacting). Each vertical bar represents a single time interval of 100 ms.

