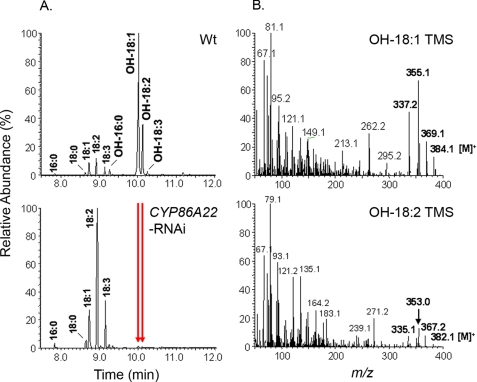
FIGURE 3.
Altered fatty acid profile in the CYP86A22-RNAi stigma of transgenic petunia lines. A, GC-MS analysis of fatty acid composition of the wild-type stigma (upper panel) and the RNAi stigma (lower panel). The arrows indicate the corresponding ω-hydroxy fatty acids disappearing in the CYP86A22-RNAi stigma. B, the mass spectra of TMS derivatives of ω-hydroxyoleic acid (OH-18:1, upper panel) and ω-hydroxylinoleic acid (OH-18:2, lower panel) of wild-type stigma.

