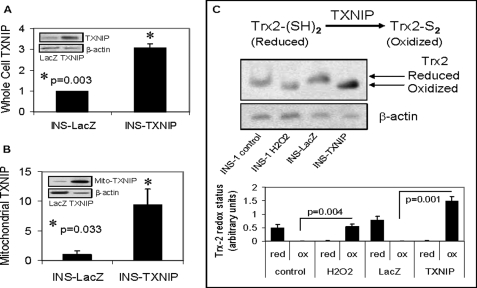
FIGURE 5.
Overexpression of mitochondrial TXNIP and Trx2 oxidation. A and B, whole cell and mitochondrial TXNIP expression, respectively, in control INS-LacZ and TXNIP-overexpressing INS-TXNIP cells as assessed and quantified by immunoblotting. Error bars represent means ± S.E. of at least three independent experiments corrected for β-actin. Insets, representative immunoblots. C, redox immunoblot and quantification of Trx2 in mitochondrial fractions of control and H2O2-treated INS-1 cells and control INS-LacZ and INS-TXNIP cells. Cell extracts were alkylated with AMS as described under “Experimental Procedures.” Upper bands represent reduced (red) Trx2, and lower bands represent oxidized (ox) Trx2. β-Actin was used as a loading control. One representative of three independent experiments is shown. Error bars represent means ± S.E.

