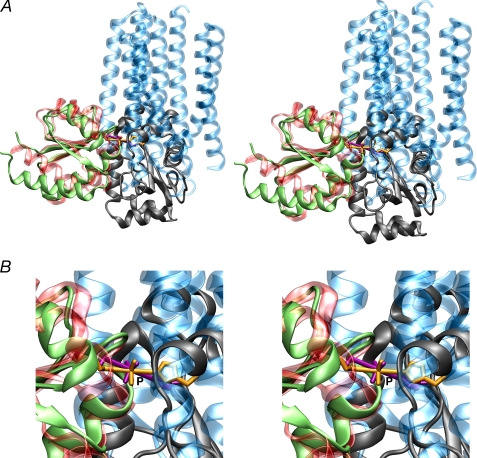
FIGURE 7.
Comparison of the IIAChb*-IIBChb and IIAMtl-IIBMtl complexes. A, overall stereoview and, B, stereo close up of the His-P-Cys phosphoryl transition state, with IIBChb and IIBMtl superimposed. The backbone is displayed as a ribbon diagram and the His-P-Cys transition state as a stick diagram. IIAMtl and IIBMtl are shown in green and gray, respectively; IIAChb* and IIBChb are shown in transparent blue and red, respectively; and the His-P-Cys phosphoryl transition state is shown in gold for the IIAChb*-IIBChb complex and in purple for the IIAMtl-IIBMtl complex. The coordinates of the IIAMtl-IIBMtl complex are taken from Ref. 36 (PDB code 2FEW). The superposition of IIBChb and IIBMtl was carried out using the program O (79).

