
Figure 3. Regulation of NFAT activity leads to changes in OPN protein expression in intact arteries.
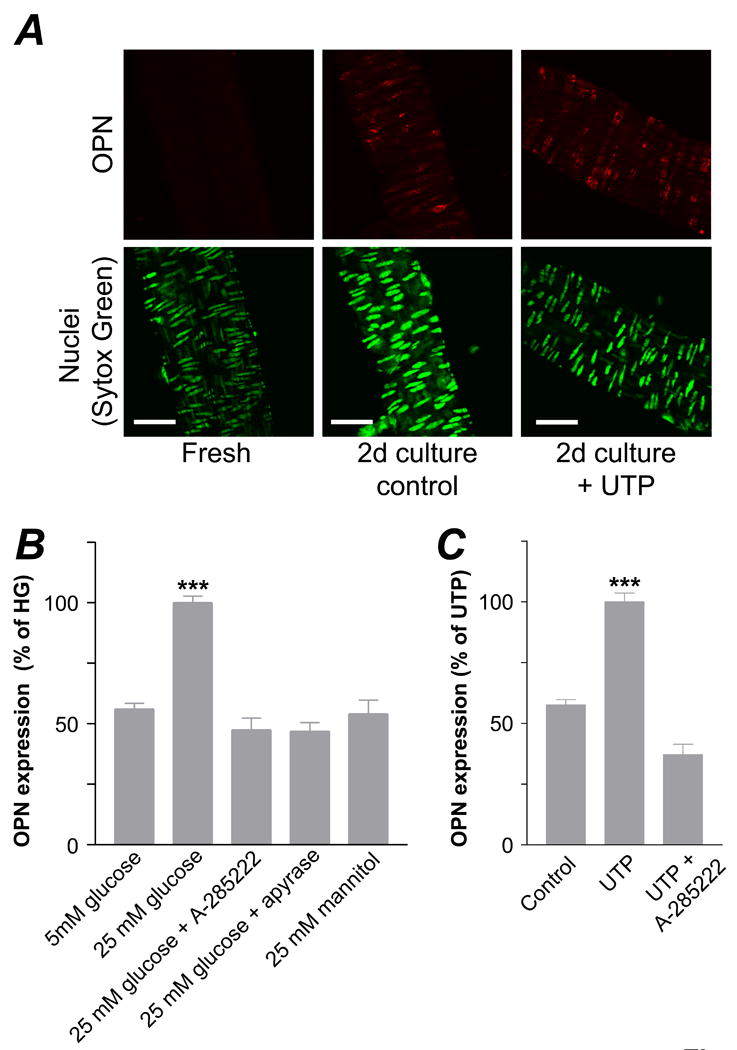
A. Confocal images showing expression of OPN (red, upper panels) in cerebral arteries and nuclear staining with SYTOX Green (lower panels). Arteries were stained immediately after dissection (fresh) or after 2d organ culture in the presence or absence of UTP (10 μmol/L, supplemented daily). Bars=50 μm. B. Summarized confocal data showing OPN expression in cerebral vessels cultured for 2d in 5 mmol/L and 25 mmol/L glucose (90.1 and 450.5 mg/dL respectively) with or without A-285222 (1 μmol/L) or apyrase (0.32 U/mL), or in 25 mmol/L mannitol. Values are normalized to 25 mmol/L glucose (N=13, 26-126 images analyzed in each group, ***P < 0.001 for 25 mmol/L glucose vs. all other bars). C. Summarized confocal data showing OPN expression in cerebral arteries cultured for 2d with or without UTP (10 μmol/L) in the presence or absence of A-285222 (1 μmol/L). Values are normalized to UTP (N=6, 26 to 75 images analyzed in each group, ***P < 0.001 for UTP vs. all other bars).