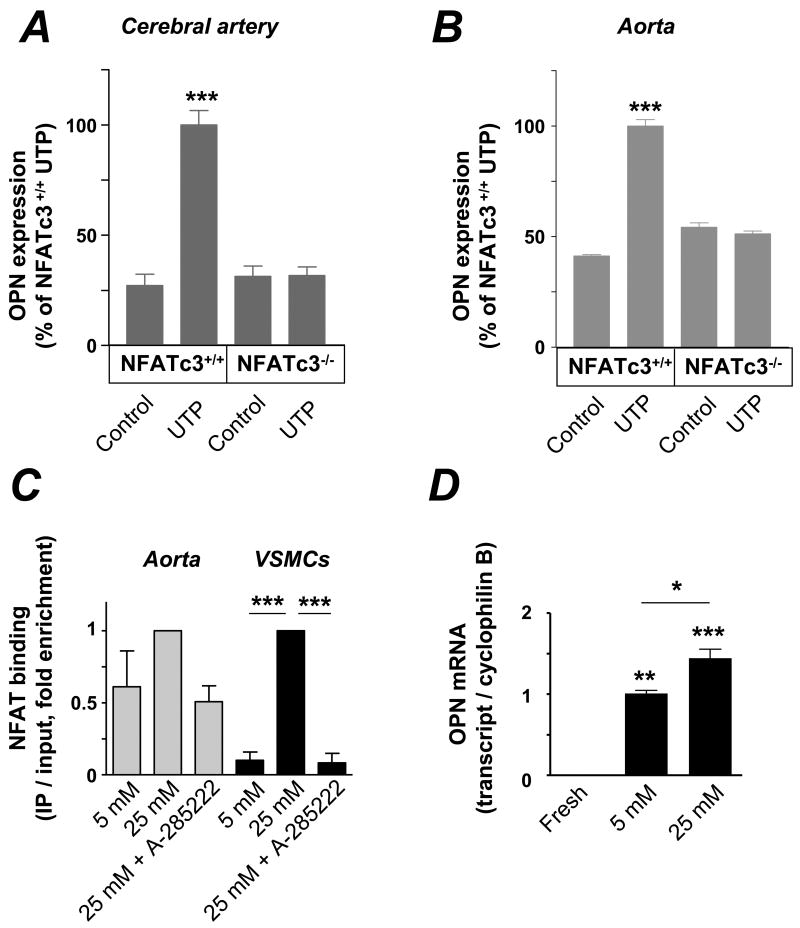
Figure 4. Involvement of NFATc3 in the regulation of OPN expression.
A & B. Summarized data from confocal immunofluorescence experiments showing increased OPN expression upon UTP stimulation for 3 d in intact cerebral arteries and aortas from NFATc3+/+ mice, but no effect in arteries from NFATc3-/- mice. Aortas were divided in halves and cultured either with or without UTP (100 μmol/L, N=3, 45-57 images analyzed in each group, ***P < 0.001 vs. all other bars). For the cerebral arteries, half of the arteries from each mouse were cultured with UTP and the other half without (10 μmol/L, N=3, 15-21 images in each group, ***P < 0.001 vs. all other bars). C. VSMCs and intact aortas were incubated for 3 hours in 5 mmol/L glucose or 25 mmol/L glucose with or without 1 μmol/L A-285222. NFATc3 enrichment by ChIP was performed and associated DNA complexes analyzed by quantitative PCR (in triplicates). Primers specific to NFAT binding site 3 of the OPN promoter were used. Aortas from 3-4 mice were used for each IP reaction, experiments were performed 3-5 times (for VSMCs and aortas, respectively), ***P < 0.001. D. OPN mRNA expression in fresh and cultured aortas (2 days in 5 mmol/L or 25 mmol/L glucose containing media). Results are shown as ratio of OPN expression to cyclophilin B, normalized to 5 mmol/L glucose. N=2, 10, 18 for fresh, 5 mmol/L and 25 mmol/L glucose respectively, in triplicate, *P < 0.05; **P < 0.01 and ***P < 0.001.

