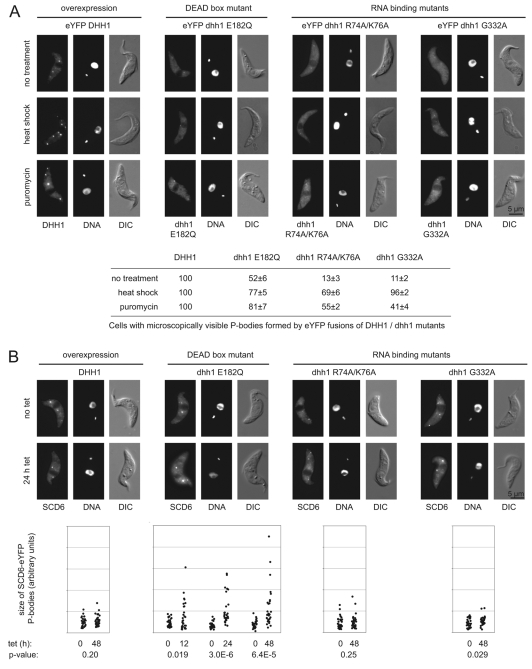
Fig. 3.
Subcellular localisation of DHH1 wild type and mutants. (A) Images of representative cells expressing eYFP-DHH1 wild type and mutants after 12 hours induction and the effect of heat shock and puromycin on the subcellular distribution. The percentage of cells (n=150) with microscopically visible P-bodies in each case is shown below. (B) Effect of expression of DHH1 wild type and mutants on subcellular localisation of SCD6-eYFP, an independent P-body marker. Representative images are shown 0 and 24 hours after induction. Quantitation of P-body size is shown below; 30 cells per time point were measured and P-values of a Student's t-test comparing uninduced and induced cells are shown.

