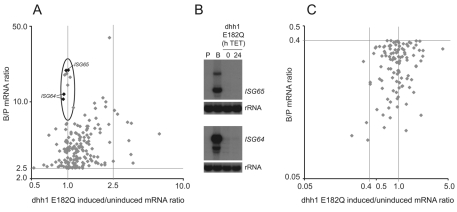
Fig. 9.
Comparison of the dhh1-E182Q and the BSF:PCF microarray. Effect of dhh1-E182Q expression on (A) mRNAs developmentally upregulated in bloodstream forms (B:P >2.5), and (C) mRNAs developmentally downregulated in bloodstream forms (B:P <0.4). In both cases the B:P ratio is on the y-axis and the dhh1-E182Q-induced:uninduced value is on the x-axis. In A, the group of strongly developmentally regulated mRNAs unaffected by dhh1 E182Q are circled and two genes of this group have been analysed by northern blot (B).

