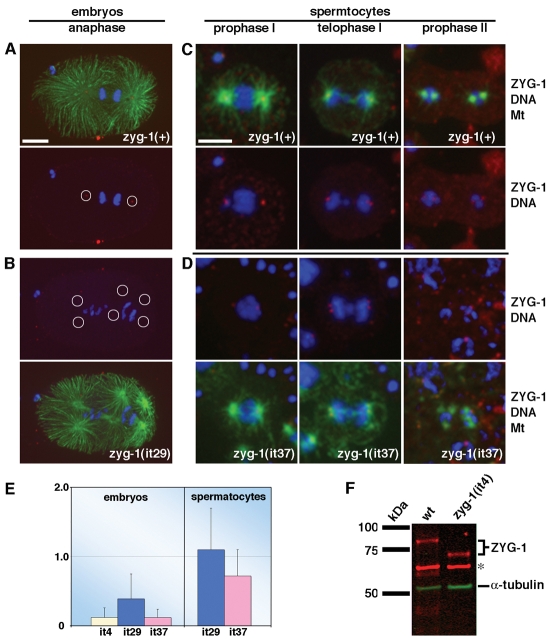
Fig. 5.
Truncation of ZYG-1 specifically disrupts recruitment to mitotic centrosomes. (A-D) Embryos (A,B) and spermatocytes (C,D) stained for ZYG-1 (red), microtubules (green) and DNA (blue). A zyg-1(+) embryo (A) and a zyg-1(it29) embryo (B) are shown. Relative to full-length ZYG-1, significantly less truncated ZYG-1 is detected at mitotic centrosomes. Circles indicate the positions of centrosomes. Embryos in A and B are shown at same magnification. Scale bar: 10 μm. zyg-1(+) (C) and zyg-1(it37) spermatocytes (D) are shown. Similar levels of ZYG-1 are detected at meiotic centrosomes. All spermatocytes are shown at same magnification. Scale bar: 5 μm. (E) Quantitative immunofluorescence microscopy reveals that ZYG-1 levels at mitotic, but not meiotic, centrosomes are diminished in class II mutants. (F) Quantitative immunoblotting demonstrates that wild-type (wt) and zyg-1(it4) embryos possess similar amounts of ZYG-1 protein. α-tubulin and a nonspecific band (asterisk) serve as loading controls.

