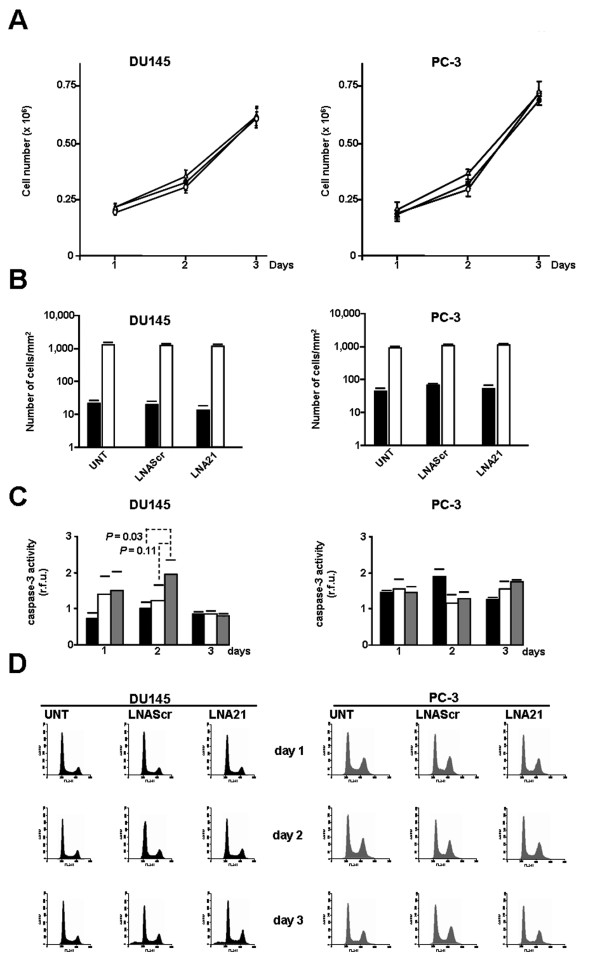
Figure 2.
Analysis of the effects of miR-21 knockdown on PCa cell behavior. (A) Growth curves of untreated (white triangle), LNAScr (black circle)- or LNA21 (white circle)- transfected DU145 and PC-3 cells. (B) Analysis of the migrating (black bars) and invading (white bars) capabilities of PCa cells (number of cells/mm2) at day 3, in untreated (UNT) and LNAScr- or LNA21-transfected cells. (C) Time-course determination of caspase-3 catalytic activity in untreated (black bars) and LNAScr- (white bars) or LNA21-transfected (grey bars) cells. R.f.u.: relative fluorescence units. (D) Time-course analysis of the cell cycle in UNT or oligomer-transfected PCa cells. Data represent mean values ± SD of at least three independent experiments.

