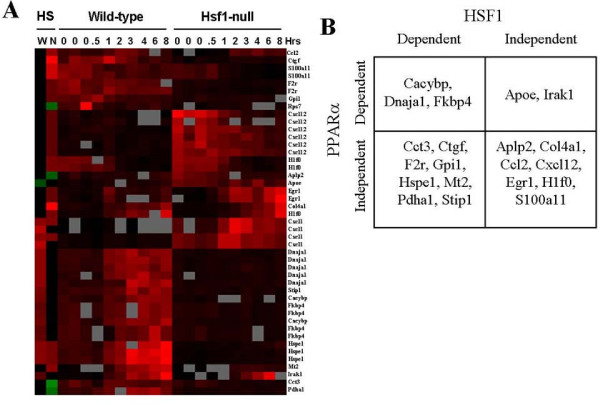
Figure 7.
Regulation of heat shock genes by HSF1 and PPARα. Genes which exhibited significant changes in expression due to HS from the dataset of Trinklein et al. (2004) and from the present study were identified. A. Heat map of gene expression changes by HS in wild-type (W) and PPARα-null (N) mice compared to the Trinklein et al. (2004) dataset. In the Trinklein et al. (2004) study, mouse embryonic fibroblasts were subjected to HS followed by recovery for the indicated times in hrs. Genes were subjected to one-dimensional hierarchical clustering. Red, up-regulation; green, down-regulation; grey, no data; black, no change. B. Classification of genes based on regulation by PPARα and HSF1.

