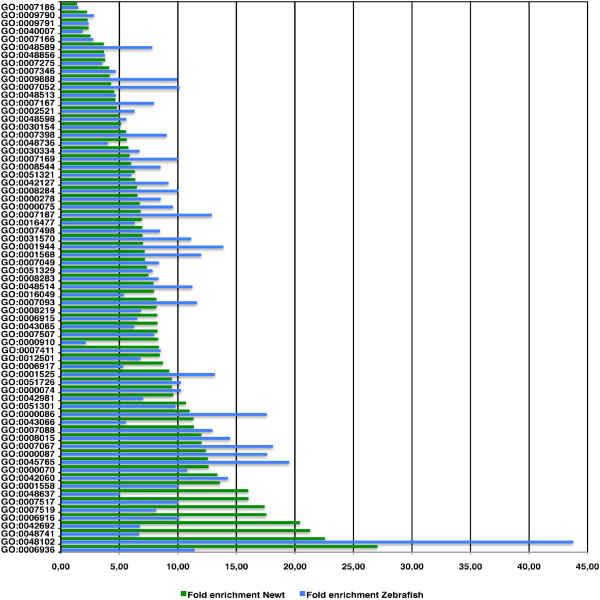
Figure 5.
Accumulation of proteins annotated to GO terms containing more than 2 zebrafish proteins and more than 7 newt proteins. Fold enrichment was determined by comparing the ratio of proteins annotated to the complete GOA dataset relative to the ratio of annotated newt and zebrafish proteins. 12 GO term nodes display more than 10 fold enrichment in proteins for newt and zebrafish datasets.

