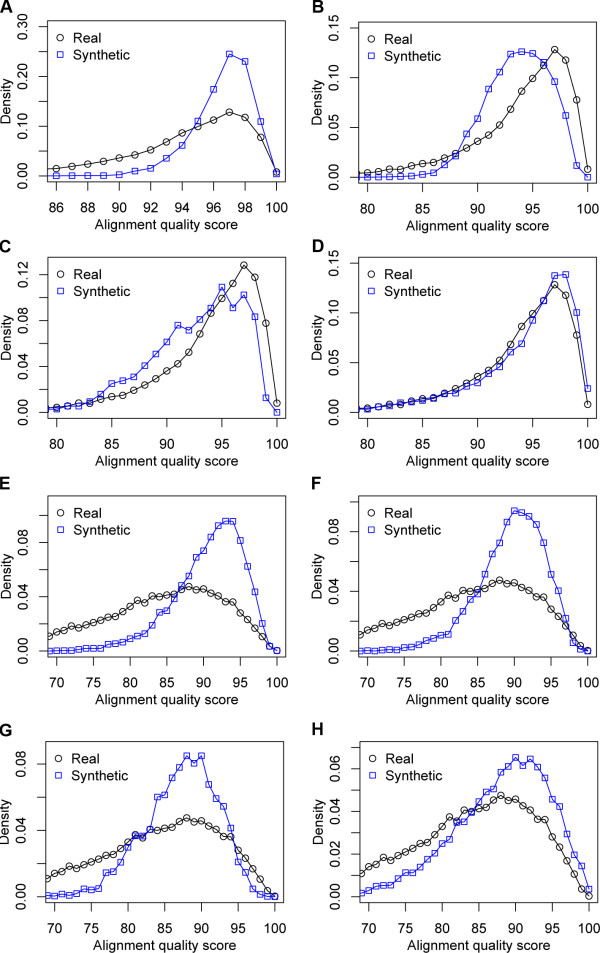
Figure 2.
Distributions of alignment quality scores - HoT SPS (A-D) and HoT CS (E-H) - between real and simulated sequences. Synthetic sequences were simulated by (A, E) a traditional method, (B, F) using a mixture model of evolutionary rates, (C, G) using a mixture model of ratios of substitutions to indels, and (D, H) a novel method that relies on observed genome-wide distributions of its parameters.

