
Figure 5.
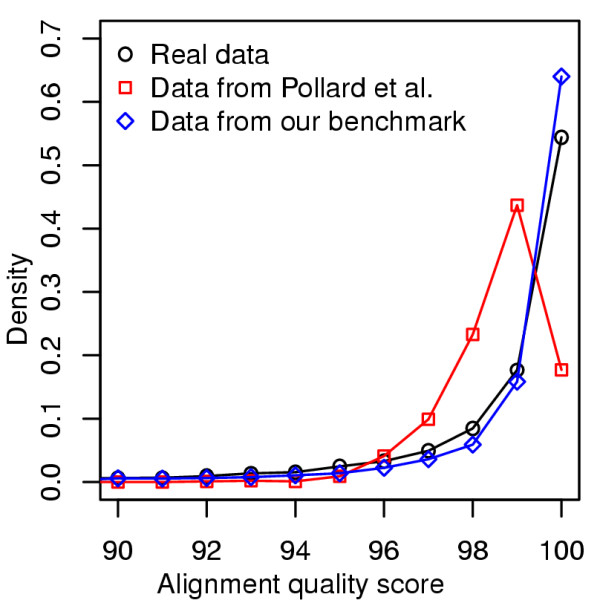
Distributions of alignment quality scores of data sets representing D. melanogaster - D. pseudoobscura pair from real genomes, Pollard et al. [21], and our benchmark. The collected data sets from each of the three sources were aligned by Pecan [33] and then their alignment quality scores were calculated by HoT SPS [27] method.