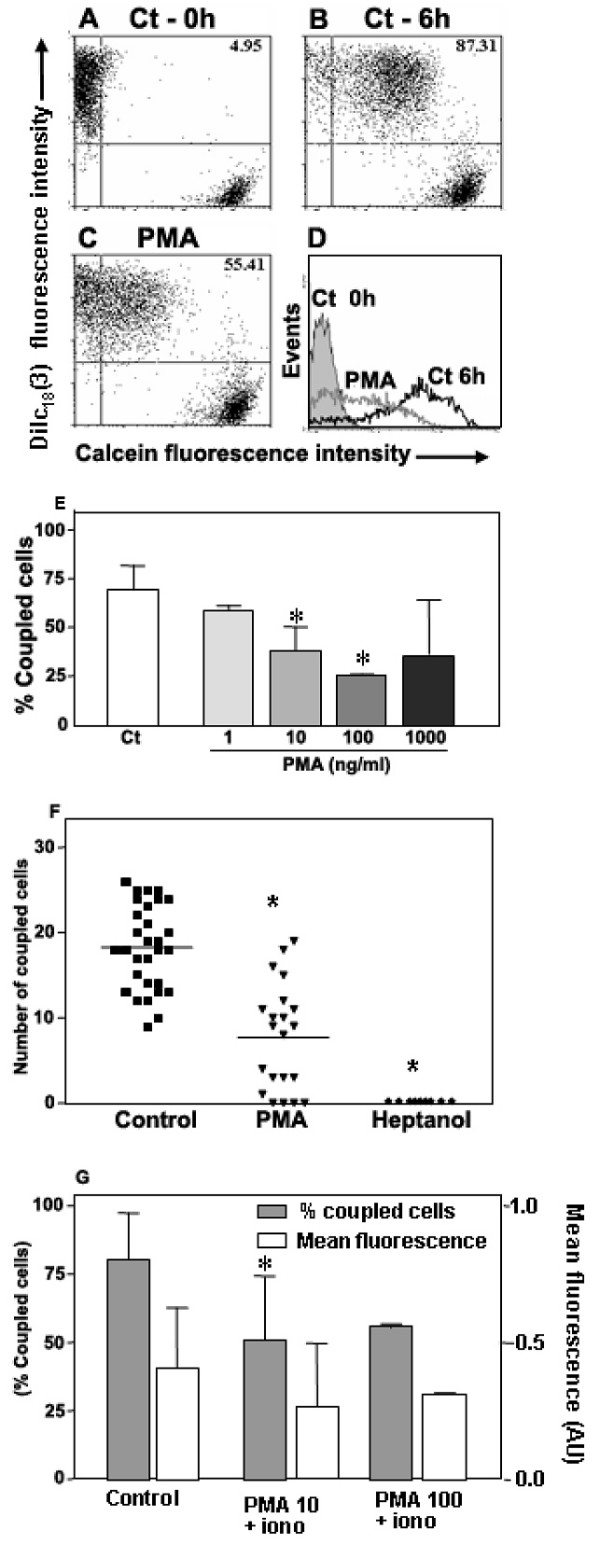
Figure 5.

Phorbol myristate acetate inhibits GJIC in mouse and human TEC. Panels A to D are flow cytometry profiles showing mouse TEC co-cultures that were either treated (C) or not (B) with PMA (10 ng/ml) and maintained for 6 hrs at 37°C. Panel A represents the TEC population, which was separately cultured (Ct - 0 hours). The percentage of double positive cells is depicted at the upper right corner of each panel. The histograms with the calcein fluorescence profile of each population are depicted in panel D: calcein-Dilc18(3)+ cells, not submitted to co-culture (gray filled profile); control co-cultured TEC (black line); co-cultured TEC treated with PMA (gray line). Data are representative of at least 4 experiments. Panel E shows a dose-response curve of the effect of PMA treatment upon inter-TEC GJIC. A significant dose-dependent inhibition of cell coupling is seen, with a plateau being reached in 100 ng/ml. (* p < 0.05). Panel F shows that PMA also down-regulates GJIC in primary cultures of TNC-derived human TEC. Panel G shows that simultaneous treatment with PMA and ionomycin also significantly inhibited dye coupling among TEC (* p < 0.05). Co-cultures of the mouse TEC line were treated simultaneously with PMA (10 or 100 ng/ml) and ionomycin (1 μg/ml) for 6 hrs at 37°C, analyzed by flow cytometry. The percentage of coupled cells and the calcein geometric mean fluorescence obtained from double positive cells (Mean ± SD) are shown. The data are representative of two independent experiments performed in triplicate.
