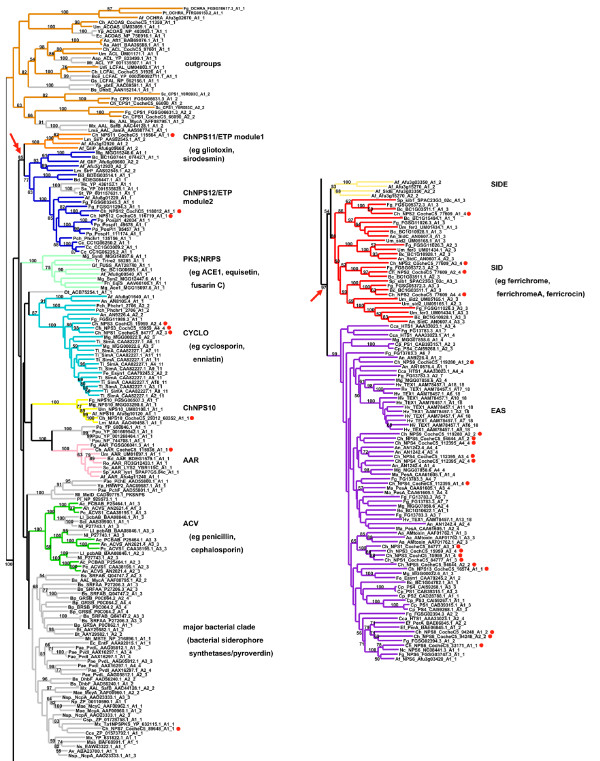
Figure 2.
ML phylogenetic tree (PhyML, WAG plus gamma) from the reduced A domain dataset. Branches corresponding to subfamilies are color coded as in Fig. 1 and known products of NRPSs within each subfamily are shown to the right in parentheses. All C. heterostrophus NRPS A domains are indicated as red dots. Bootstrap values greater than 50% are shown above branches, where legibility makes this possible. This analysis shows stronger bootstrap support (97%) for grouping the exclusively fungal, multimodular subfamilies, SID and EAS subfamilies together (arrow). Double arrow indicates high bootstrap support (>85%) for grouping ChNPS11/ETP/ChNPS12 together.

