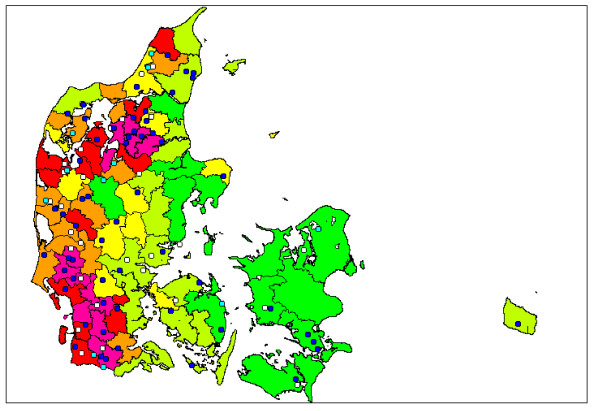
Figure 2.
Geographical distribution of 100 randomly selected Danish dairy herds tested for antibodies against Coxiella burnetii in the spring of 2008. The herds were categorized as either test positive (S/P > 40%) (Blue colour), test intermediate (30% ≤ S/P ≥ 40%) (Turquoise colour) or test negative (S/P < 30%) (White colour). The regional dairy herd density is presented by the following colours: Green: <0.07; Pale green: 0.07-0.10; Yellow: 0.10-0.14; Orange: 0.14-0.16; Red: 0.16-0.23; Purple: >0.23 herds/km2.

