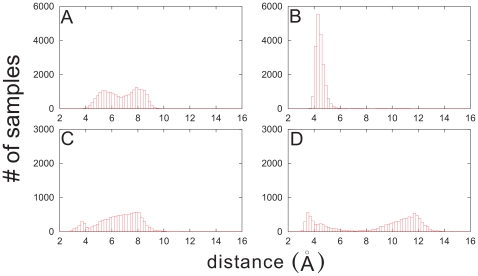
Figure 7. Histograms of number of samples as a function of atom-pair distances in the two minima of PMF.
The distance between W47/W58 of PDC109/a and the N atom of PhC in the first (2.5 Å 3.5 Å) (A) and second (5.2 Å
 6.0 Å) (B) minima were calculated from the trajectory saved from the PMF calculation in the window 2.0 Å
 6.0 Å. The corresponding results for the separation between Y60 of PDC109/a and PhC phosphate group are shown in (C) and (D).

