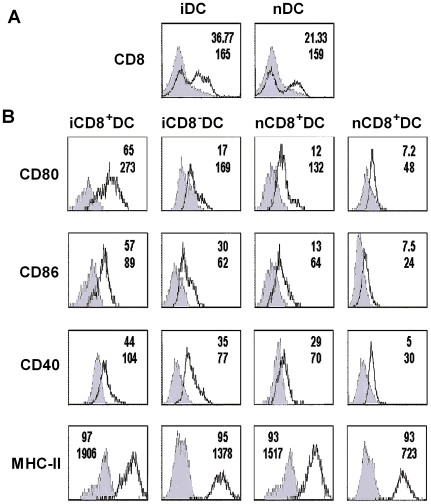
Figure 1. BCG immunization induced the expansion of CD8+ DC which expressed higher levels of co-stimulatory molecules compared with CD8- DC.
Mice (C57BL/6, n = 4/group) were infected i.v. with 5×10⁵ CFU of BCG and sacrificed at 21 days after immunization. Total DCs from infected and naïve mice were purified using the MACS CD11c+ isolation column. Purified DCs were co-stained with APC-conjugated anti-CD11c, PE-Cy7-conjugated anti-CD8 and FITC-conjugated Ab specific for one of the surface markers (CD80, CD86, CD40 or MHCII). The surface marker expression (solid lines) or matched Ab isotype control (shaded histogram) are shown respectively. All histogram were based on 10,000 cells satisfying a gate set of forward vs side scatter light histogram. A, purified DCs were gated on CD11c positive cells showing CD8+ DC population in infected (iDC) and naïve (nDC) mice. B, purified DC were gated on either CD11c+ CD8+ DC (CD8+DC) or CD11c+CD8− DC (CD8− DC) and the surface molecules on the DC subsets were shown. The percentages of positive cells and mean fluorescence intensity (MFI) for the molecules were shown at the top and bottom lines respectively at the right upper corner of each histogram.

