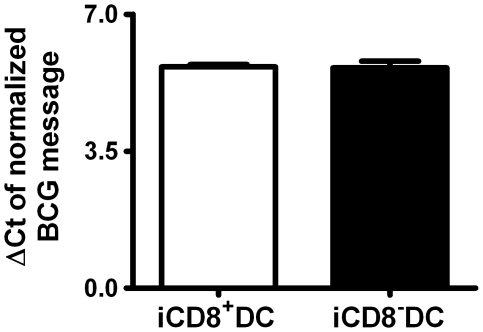
Figure 9. DC subsets from BCG-infected mice show similar BCG load.
A real-time RT-PCR using the green fluorescent dye SYBR Green I was applied to determine the relative concentration of BCG mRNA in iCD8+DC and iCD8−DC. The BCG mRNA in different DC subsets was amplified as described in Materials and Methods. The BCG mRNA level was normalized to GAPDH mRNA in different DC subsets demonstrated as ΔCt. ΔCt = Ct (BCG)–Ct (GAPDH), the threshold cycle of a BCG and the threshold cycle of the corresponding GAPDH in the same sample.

