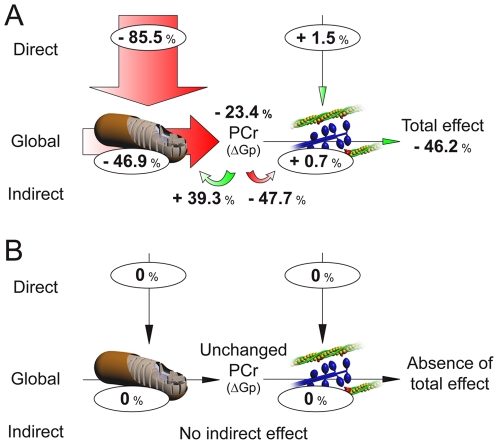
Figure 2. Modular Regulation Analysis of the effects of the decrease in oxygen availability on Control (A) and CH (B) mouse hearts.
The size of the arrows is proportional to the effect of the decrease in oxygen availability, and the figures represent the effect expressed as % change from starting condition (high oxygen).

