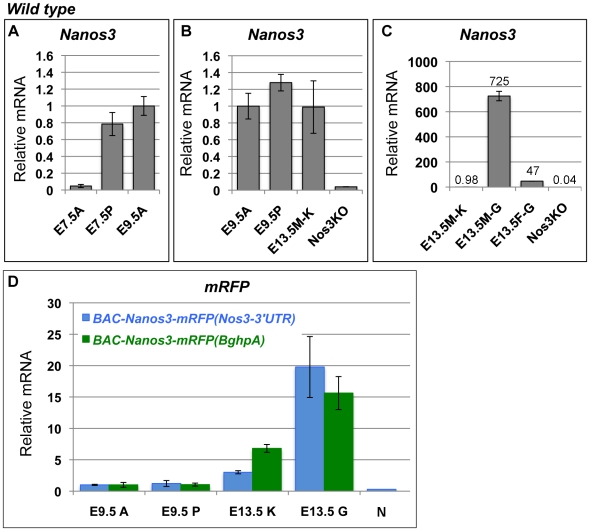
Figure 4. The accumulation of somatic Nanos3 mRNA is suppressed by the Nanos3-3′UTR.
The levels of Nanos3 (A–C) or mRFP (D) mRNA were compared by quantitative RT-PCR using RNA samples derived from wild-type embryos (A–C) and BAC-Nanos3-mRFP(Nos3-3′UTR) (blue in D) and BAC-Nanos3-mRFP(BghpA) (green in D) transgenic embryos at E7.5, E9.5 and E13.5. Data were normalized by G3PDH in each sample. The relative mRNA levels in the E9.5A sample (an anterior part of E9.5 embryo) were assigned the reference value of 1.0. A, anterior part of the embryo; P, posterior part of the embryo; M–K or K, the male kidney; M–G or G, the male gonad; F–G, the female gonad; N, the posterior part of a Nanos3 knockout embryo at E9.5. Error bars represent the s.d.

