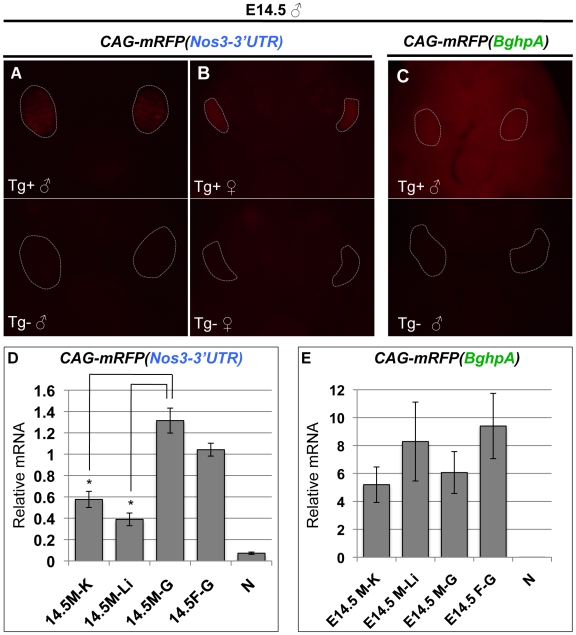
Figure 5. Nanos3-3′UTR is sufficient to establish the germ cell-specific expression pattern in the mouse embryo.
(A–C) Fluorescence images of CAG-mRFP(Nos3-3′UTR) (A, male; B, female) and CAG-mRFP(BghpA) (C, male) transgenic embryos at E14.5. The upper images are of the abdomens of embryos harboring transgenes (Tg+), whereas the lower panels show corresponding images from embryos lacking a transgene (Tg−). Broken gray lines indicate gonads. (D–E) Quantitative RT-PCR analysis of mRFP in CAG-mRFP(Nos3-3′UTR) (D) or CAG-Lyn-mRFP(BghpA) (E) embryos at E14.5. The data were normalized using G3PDH. M–K, male kidney; M-Li, male limb; M–G, male gonad; F–G, female gonad; N, wild-type embryo. Error bars represent the s.d. Student t-test was used to calculate P values. *, P<0.05.

