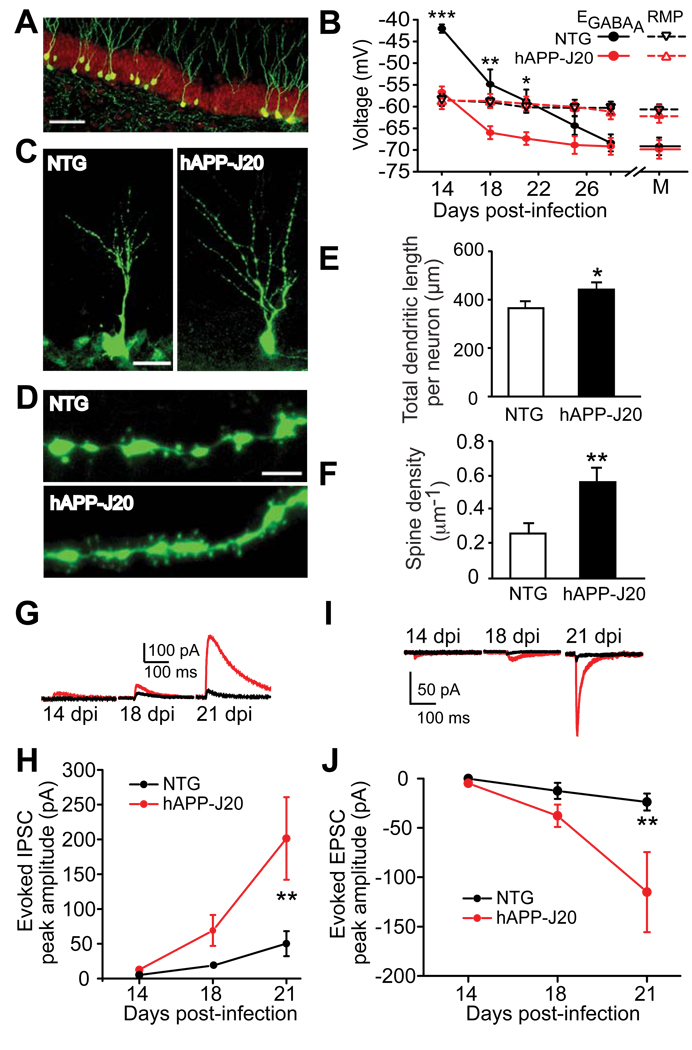
Figure 1. Accelerated Early Morphological and Functional Development of Adult-Born GCs in 2–3-Month-Old hAPP-J20 Mice.
(A) Photomicrograph of 28-day-old adult-born GCs labeled by CAG-EGFP retrovirus (green) and stained with an anti-NeuN antibody (red).
(B) GABAA Cl− current reversal potentials (EGABA) and resting membrane potentials (RMP) of adult-born GCs at 14-, 18-, 21-, 25-, or 28-dpi and of mature (M) GCs in hAPP-J20 and NTG mice. n = 6–7 neurons obtained from 3–4 mice per genotype and dpi. For EGABA, genotype F(1, 63) = 31.87; *, P < 0.05; **, P < 0.01; ***, P < 0.001; by two-way ANOVA and Bonferonni posthoc test.
(C, D) Photomicrographs of 18-day-old adult-born GCs (C) and their dendritic spines (D) in hAPP-J20 and NTG mice.
(E, F) Quantification of total dendritic length (E) and dendritic spine density (F) of adult-born GCs at 18 dpi in hAPP-J20 and NTG mice. n = 41–44 neurons (for dendritic length) and n = 17–30 dendritic segments (for spine density) from 5 mice per genotype. *, P < 0.05; **, P < 0.01, unpaired student’s t test.
(G, I) Representative traces of evoked inhibitory postsynaptic currents (eIPSCs) (G) or evoked excitatory postsynaptic currents (eEPSCs) (I) of 14-, 18-, and 21-day-old adult-born GCs in hAPP-J20 (red) and NTG (black) mice.
(H, J) Quantifications of peak amplitudes of eIPSCs (H) and eEPSCs (J) of 14-, 18-, or 21-day-old adult-born GCs in hAPP-J20 (red) and NTG mice (black). H: n = 5–11 neurons from 2–3 mice per genotype and dpi, genotype F(1,50) = 1.194; **, P < 0.01. J: n = 5 –10 neurons from 2–3 mice per genotype and per dpi, genotype F (1,51) = 23.68; **, P < 0.01; by two-way ANOVA, Bonferroni posthoc test.
Values are means ± SEM (E, F). Scale bars: 50 µm (A), 20 µm (C), 3 µm (D).

