
Figure 7.
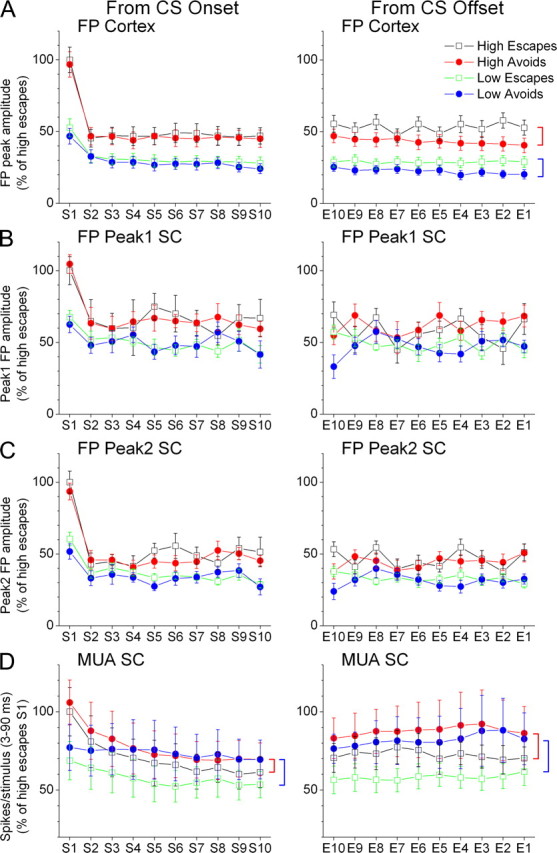
FP and MUA activity in barrel cortex and superior colliculus evoked by the WCS during performance in the High/Low active avoidance task. A–D, Cortex FP responses (A), and superior colliculus (SC) FP peak1 (B) and FP peak2 (C), and superior colliculus MUA (D) responses evoked by High and Low WCS (10 Hz) that lead to either avoids or escapes in the task. The responses are plotted from CS onset, which includes the first 10 stimuli in the WCS (s1–s10), and from WCS offset, which includes the last 10 stimuli in the WCS before avoids or before the onset of the escape interval for escapes (E10–E1, where E1 is the last stimulus). Statistically significant differences (p < 0.05) between avoids and escapes are marked with vertical brackets on the right of the figure. A red bracket indicates a significant difference between High avoids and escapes, and a blue bracket indicates a significant difference between Low avoids and escapes.