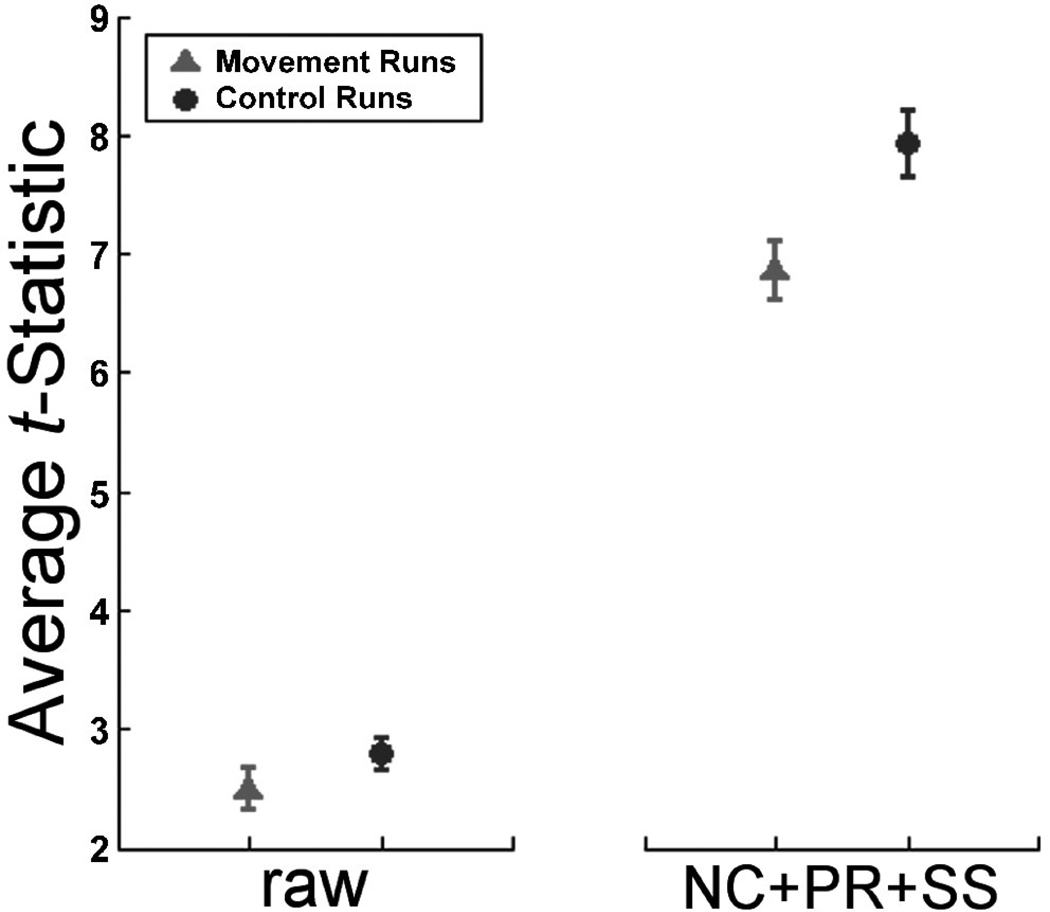
FIG. 4.
Average t-statistic in control and movement runs for the raw (unprocessed) and NC+PR+SS (navigator correction, phase regression, and spatial smoothing) pipelines. Error bars represent the 95% CI. Statistically significant differences exist between the two groups both before (p < .01) and after (p < .0001) processing.

