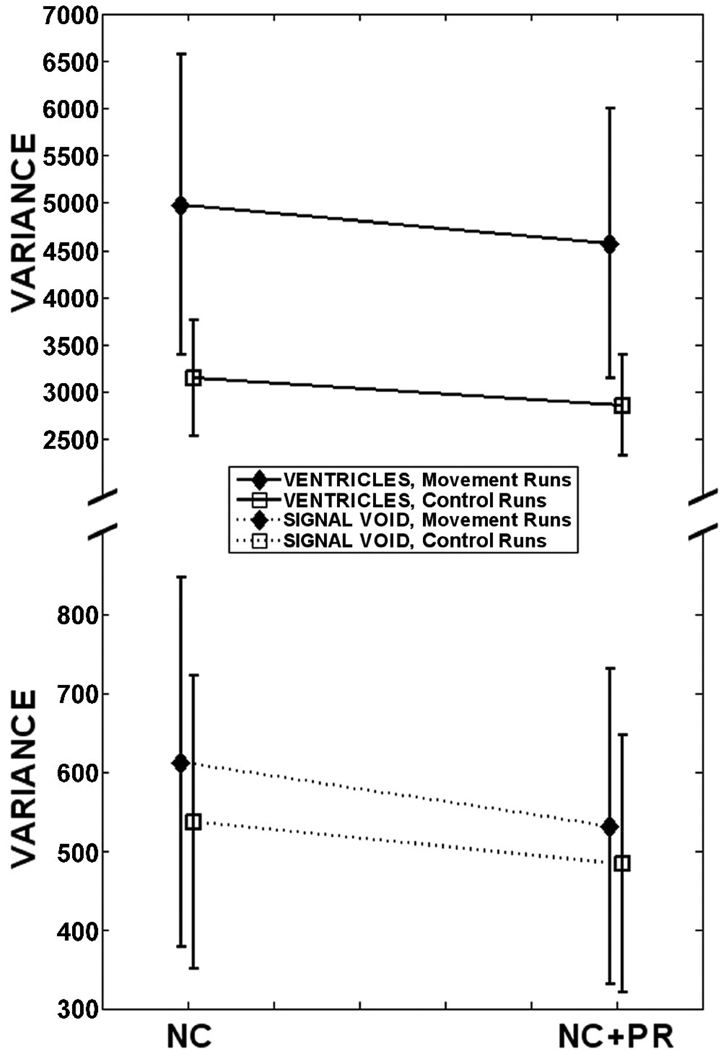
FIG. 5.
Average noise variance in VOIs through subjects’ ventricles and corpus callosum, and in signal void outside the head. Error bars represent the 95% CI. Application of PR decreased noise variance in both movement and control runs. For clarity, the vertical axis is scaled differently for each VOI. [NC = navigator correction; PR = phase regression]

