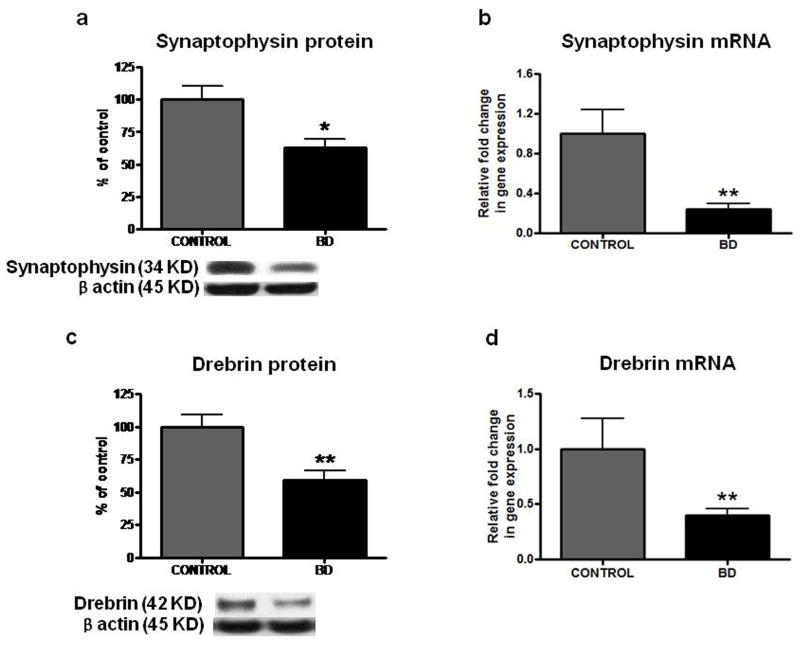
Figure 5.
Representative immunoblot of Synaptophysin (a) and Drebrin (c) protein levels in frontal cortex of controls (n = 10) and BD patients (n = 10). Data are ratios of optical density of synaptophysin and drebrin to β-actin, expressed as percent of control. mRNA levels of Synaptophysin (b) and Drebrin (d) in postmortem control (n = 10) and BD (n = 10) frontal cortex, measured using real time RT-PCR. Mean ± SEM, *p < 0.05, **p < 0.01, *** < 0.001.

