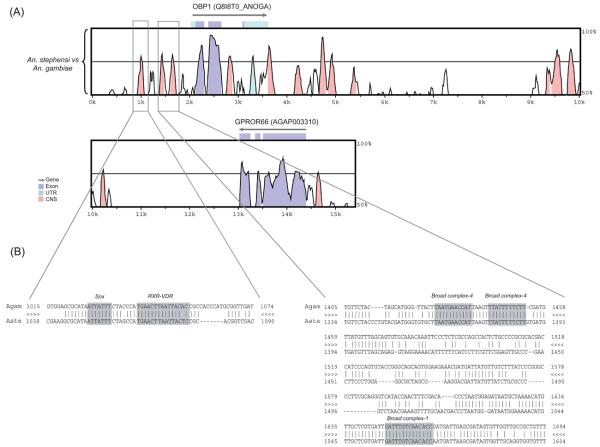
Figure 2.
Pairwise comparison between Anopheles gambiae and An. stephensi genomic sequences including the odorant-binding protein 1 (Obp1) gene and the nearby sequences. (A) VISTA plot that shows the alignment between An. gambiae and An. stephensi. The x-axis shows the relative position of the An. gambiae genomic DNA used as the reference genome in the alignment. The y-axis shows the % identity between the compared species. Arrows above the plots correspond to genes or coding sequences annotated in the An. gambiae genome according to the Ensembl database. The cut-off for sequence conservation is 75% over 100bp. The coding sequence portion of the third exon of the Obp1 gene is only 18bp long, which is why it does not show a conserved peak. The boxed regions correspond to the conserved noncoding sequences that were further investigated for transcription factor binding sites. Coding regions are shown in purple, untranslated regions are in light blue, and conserved non-coding sequences are shown in pink. CNS, conserved noncoding sequences. UTR, untranslated region. (B) VISTA alignment between An. gambiae and An. stephensi corresponding up to 1 kb upstream of the Obp1 transcription start site (boxed regions). Potential TFBS that are conserved for the two species are highlighted in the alignment. Three sites for two Broad complex isoforms are shown. The first and second Broad complex-4 sites are reverse complementary.

