Figure 5.
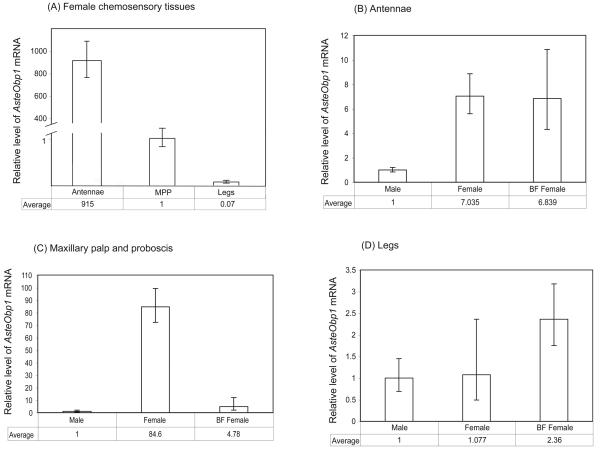
Relative amount of the Obp1 mRNA in adult chemosensory tissues of An. stephensi. The y-axis is the relative level of AsteObp1 mRNA as determined by the 2−ΔΔCT method. Detailed data analyses are shown in Table 1 and Supplementary Material Tables S1-S3. The results are shown as the mean and a range specified by 2−(ΔΔCT+SD) and 2−(ΔΔCT−SD), where SD is the standard deviation, for three or more biological replicates each from independent collections. (A) Comparison of AsteObp1 expression levels in different female chemosensory tissues. (B) Comparison of AsteObp1 expression levels in the antenna of male, female and blood-fed females. (C) Comparison of AsteObp1 expression levels in the maxillary palp and proboscis of male, female and blood-fed females. (D) Comparison of AsteObp1 expression levels in the legs of male, female and blood-fed females. The relative amount of AsteObp1 is significantly different between different chemosensory tissues in the females (Panel A; P < 0.001, One-way ANOVA with Tukey's post test). The relative amount of AsteObp1 in antennae of non-blood fed females and blood-fed females, and the relative amount of AsteObp1 in legs of male and female mosquitoes are not significantly different (Panels B-D) (P > 0.05, One-way ANOVA with Tukey's post test). In all cases, the calibrator sample for normalization show an average value of 1.

