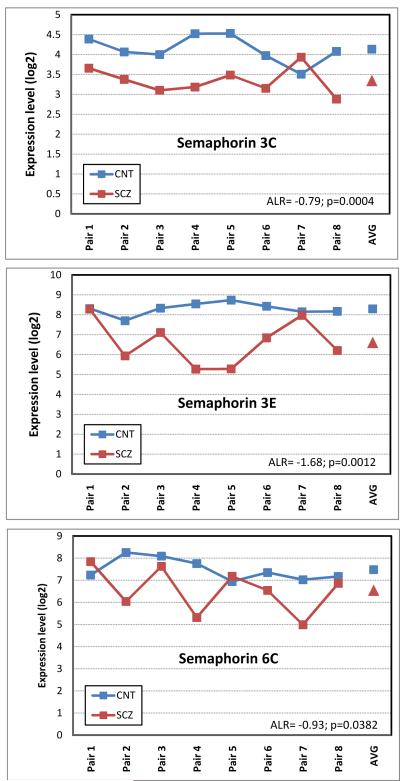
Figure 5. Gene expression profile across subjects for three Semaphorin family members.
In each figure, sample pairs are denoted on X axis (AVG corresponds to mean), Y axis denotes RMA normalized log2 expression level. Blue symbols represent control subjects, red symbols correspond to subjects with schizophrenia. Note the downregulation of all three SEMA genes across the subject pairs.

