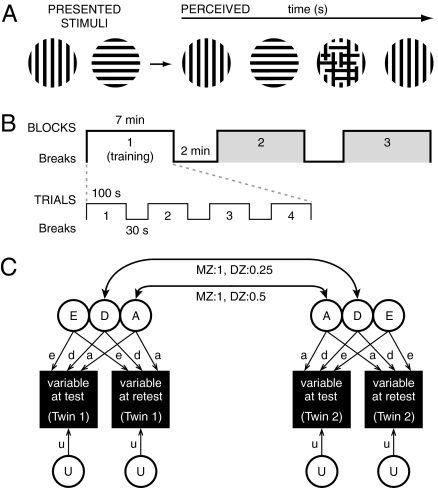
Fig. 1.
Binocular rivalry and genetic modeling. (A) Presenting a different image simultaneously, one to each eye, induces binocular rivalry (with occasional mixed percepts). In the present study, stimuli comprised drifting vertical and horizontal square-wave gratings. Binocular rivalry measures were rate (Hz), predominance (ratio of time spent perceiving one image relative to the other), number of mixed hits, and time associated with mixed hits. (B) Binocular rivalry data were collected for 21 min in three blocks. Block 1 was used for training and was discarded. Data from Blocks 2 and 3 were analyzed and were of most interest because binocular rivalry rates tend to stabilize with viewing time (8). (C) Path modeling of variance (12) into additive (A) and nonadditive (i.e., dominance/epistasis, D) genetic sources, unique environmental sources (E), and measurement error/unreliability (U). An ADEU model was chosen because the MZ twin correlation was more than twice the DZ twin correlation, indicating the importance of the A and D components over C components of variance. Reliable genetic and environmental variance is identified by equating pathways from A, D, and E components to data from the first and second test occasions. The remaining variance (U) is unshared between the two test occasions but represents an equal amount of variance for each variable on each test occasion and therefore is equated. Correlations between cotwins for factors A and D are fixed at Mendelian expectations.

