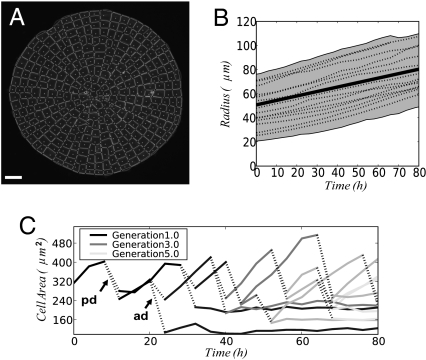
Fig. 1.
Quantitative analysis of cellular morphogenesis. (A) Image segmentation can be used to obtain a quantitative description of cellular architecture in live specimens. A microscope image of a Coleochaete scutata thallus is shown overlaid with an automatically extracted map of cell wall segments and intercellular junctions. (Scale bar: 50 μm.) (B) Time-lapse imaging allows quantitation of growth. Radial expansion of individual thalli is shown (dashed lines; the shaded area indicates the 95% confidence interval). The curves can be fitted to provide parameter values for a biomechanical growth model for C. scutata expansion (solid line). (C) The simple morphology of Coleochaete allows analysis of individual cell trajectories and geometric properties during growth. The cross-sectional areas of an individual cell and its daughter cells were tracked over 80 h. Gray levels indicate the generation (corresponding to the number of cell divisions during the experiment), and dashed lines indicate cell divisions (ad, anticlinal division; pd, periclinal division).

