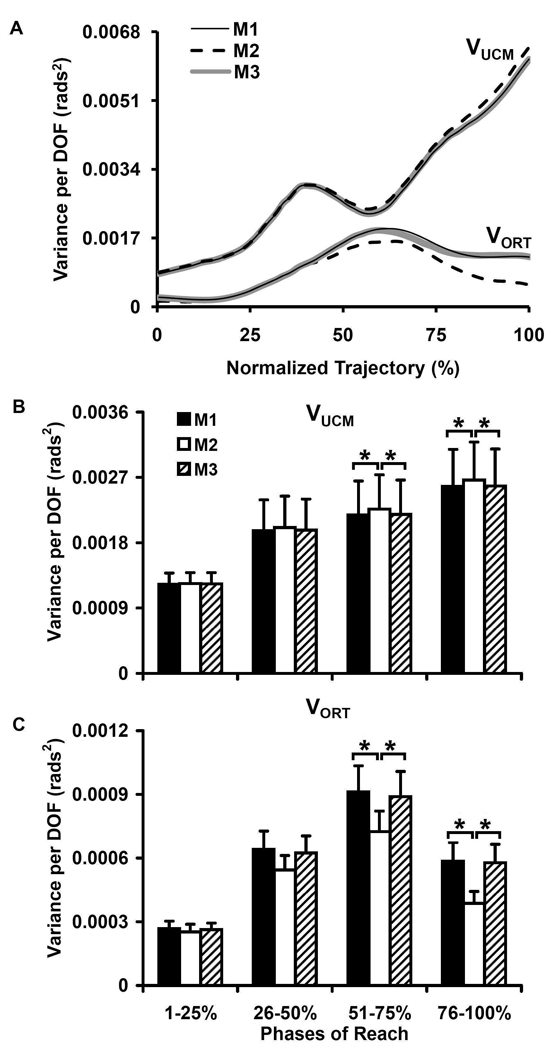
Figure 1.

Time-series of VUCM and VORT results for a representative participant (A) and VUCM (B) and VORT (C) results averaged-across participants obtained from each method within four periods of the reaching trajectory. The asterisks represent statistical significant differences with a level of significance set at p<0.05.
