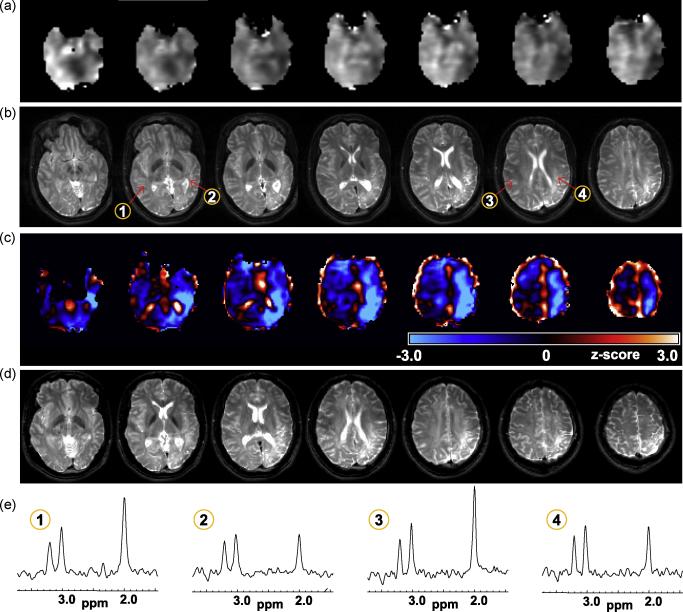
Figure 3.
Results for subject 12, showing (a) the NAA/Cre images at 7 axial slices and (b) the T2-weighted MRI corresponding to the center of the metabolite image slice. In (c) is shown the z-score image for NAA/Cre, which is shown in a color scale with black representing no change from normal values and running from −3σ to +3σ over the blue and red colors. The z-score image is shown in the standard spatial reference frame, and the T2 MRI is again shown in (d) following affine registration to this frame. In (e) are shown spectra from the numbered locations indicated in (b).

