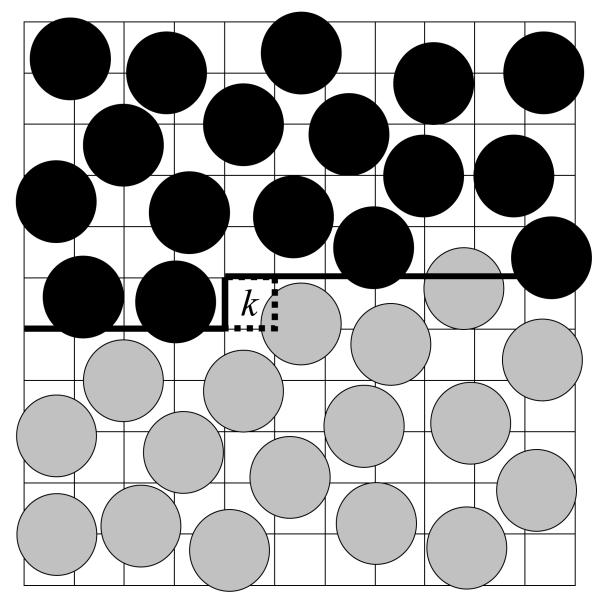
Figure 3.
A two-dimensional (2D) illustration of the main simulation (periodic) box at the kth step of the HSMC-FV reconstruction of argon. The 2D “volume” is divided into cells, where k−1 of them have already been considered in previous steps (starting from the upper left corner). These k−1 cells comprise the “past volume” (the region above the heavy lines) which contains previously treated fixed atoms that are denoted by full black circles defined by the van der Waals radius. This region is excluded from the moveable future atoms (denoted by full grey circles) which are thus simulated in the “future volume” below the heavy lines, while in the presence of the fixed atoms. The future atoms can visit the target cell k (depicted by dotted lines) and their counts in this cell lead to the transition probability of an empty cell or the transition probability density of an occupied one. Note that for the case of an occupied target cell, counts are actually accumulated for visitations to a smaller region, Vcube located inside the target cell but not shown in the figure.

