Fig. 5.

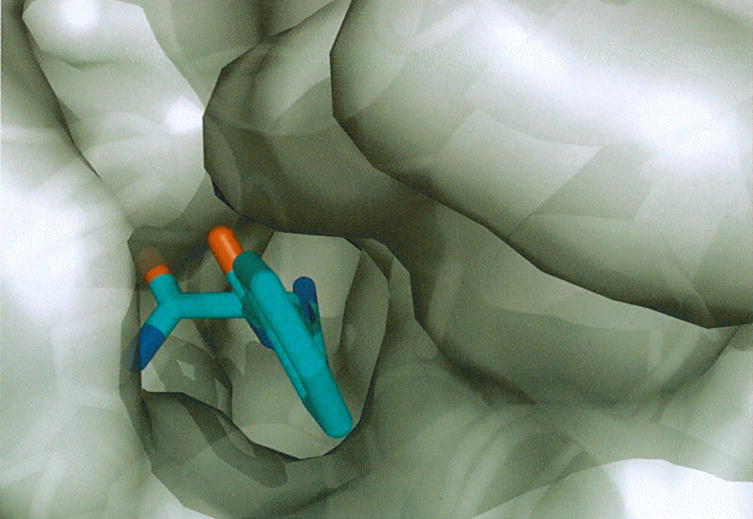
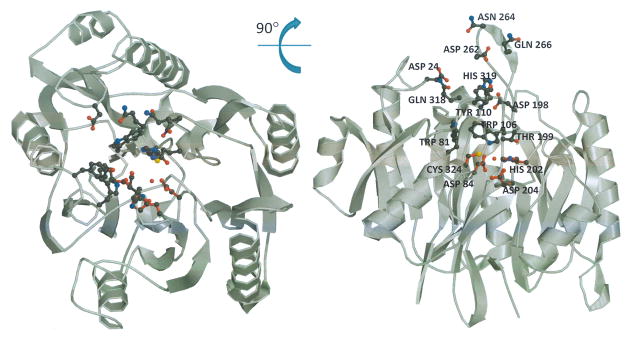
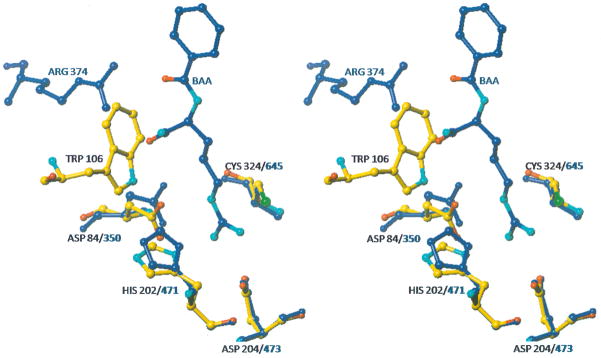
Superpositions of HpAgD and PAD4. (A) The active site cleft of HpAgD. Residues that line the entrance to the active site are highlighted. (B) Superposition of the active site residues of HpAgD (in atom color) and PAD4 (in blue) highlighting the residues that are involved in substrate recognition. A water molecule from HpAgD is shown in red. BAA, from the PAD4 structure, is shown in blue with functional moieties in atom color. (C) Entrance to the active site with HpAgD represented by its molecular surface (gray). The position of BAA, shown using stick representation, was modeled by superpositioning the PAD4 complex.


