
Fig. 2. PBT suppressed the AhR gel shift complex similarly as F5.
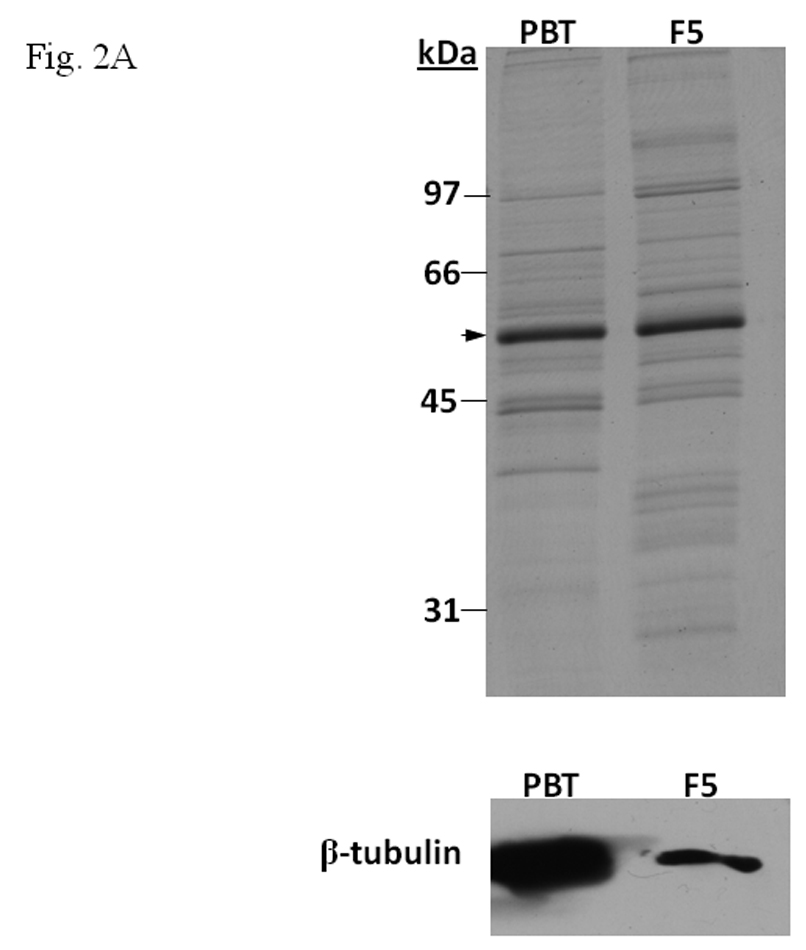
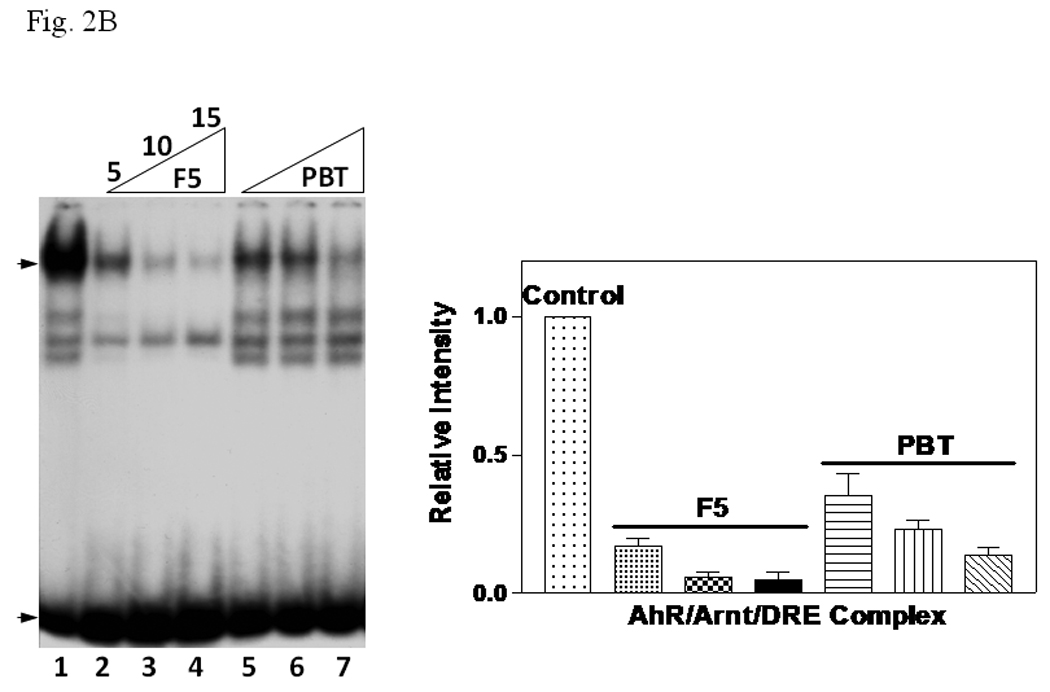
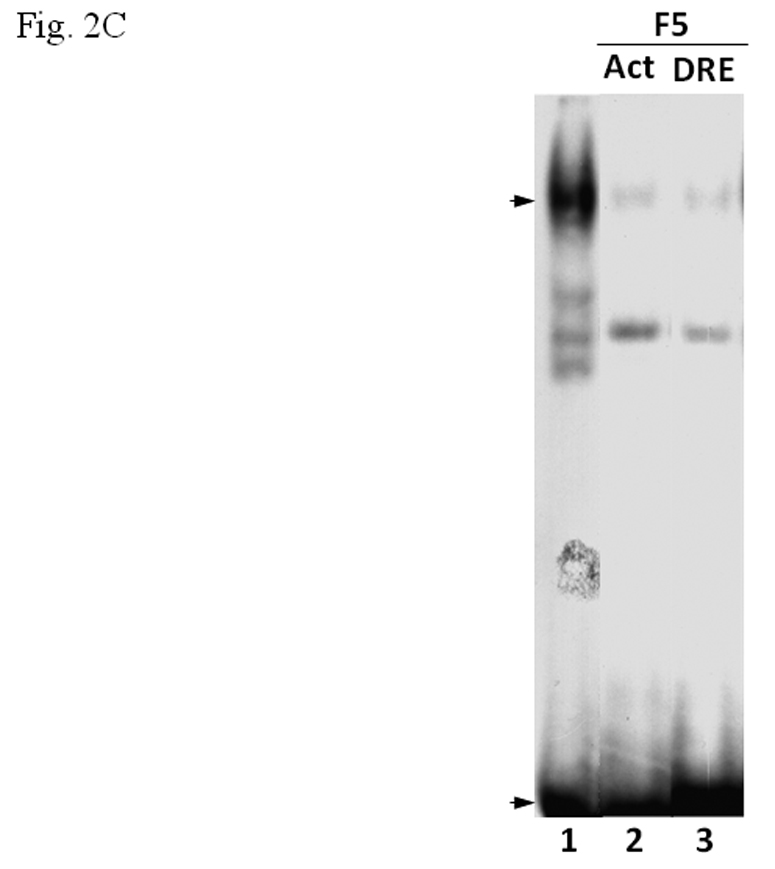
A. β-tubulin content in PBT and F5. Coomassie blue staining (top) of 2.5 µg each and Western blot analysis (below) of 2.5 µg of F5 and normalized amount of PBT based on Coomassie blue staining. The arrow indicates the β-tubulin band. B. Gel shift assay (left) showing the suppression of the AhR/Arnt/DRE gel shift complex formation by F5 and PBT. All lanes contained baculovirus expressed human AhR, Arnt, Sf9 cytosol (2.5 µg) and 7 µM βNF. B. Concentration-dependent inhibition of the AhR/Arnt/DRE complex by F5 (lanes 2–4, 5–15 µg) or PBT (lanes 5–7, equivalent to the β-tubulin content in lanes 2–4). The upper arrow indicates the AhR/Arnt/DRE complex whereas the lower arrow indicates the free probe. Graph (right) shows the quantification of the AhR/Arnt/DRE complex band intensity. The gel shift assay (left) was repeated three times and the intensity of the AhR/Arnt/DRE complex bands was measured by UN-SCAN-IT software with lane 1 arbitrarily set as 1 in each experiment to determine relative intensity. Error bars show means ± SD (n = 3). C. Gel shift assay showing that F5 suppressed the AhR gel shift complex formation when F5 was added before or after the activation step. All lanes contained baculovirus expressed human AhR, Arnt, Sf9 cytosol (2.5 µg) and 7 µM βNF. Lane 1, no F5; Lane 2, F5 was added before the activation step; lane 3, F5 was added after the activation step (added after 32P-DRE addition). The upper arrow indicates the AhR/Arnt/DRE complex whereas the lower arrow indicates the free probe.