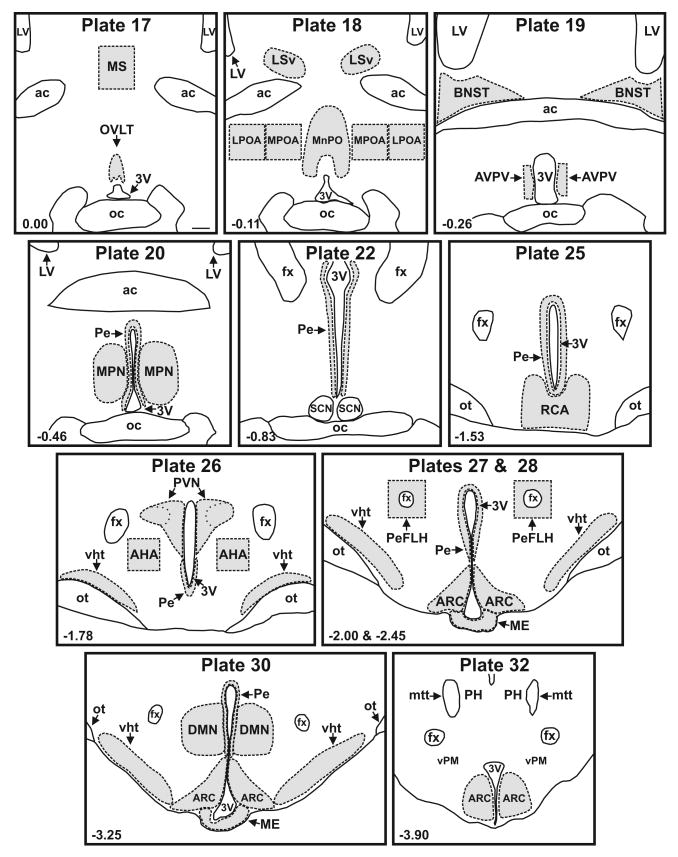
Figure 1.
Line drawings of representative sections from control rats used for analysis of NKB-ir fiber density. Sections were matched to plates in a rat brain atlas listed at the top of each drawing (Swanson, 1992) and regions of interest (shaded areas) were outlined with the aid of the adjacent Nissl-stained sections. The distance from Bregma (mm) is shown in the lower left corner of each map. Scale bar in Plate 17 = 250 μm (applies to all).

