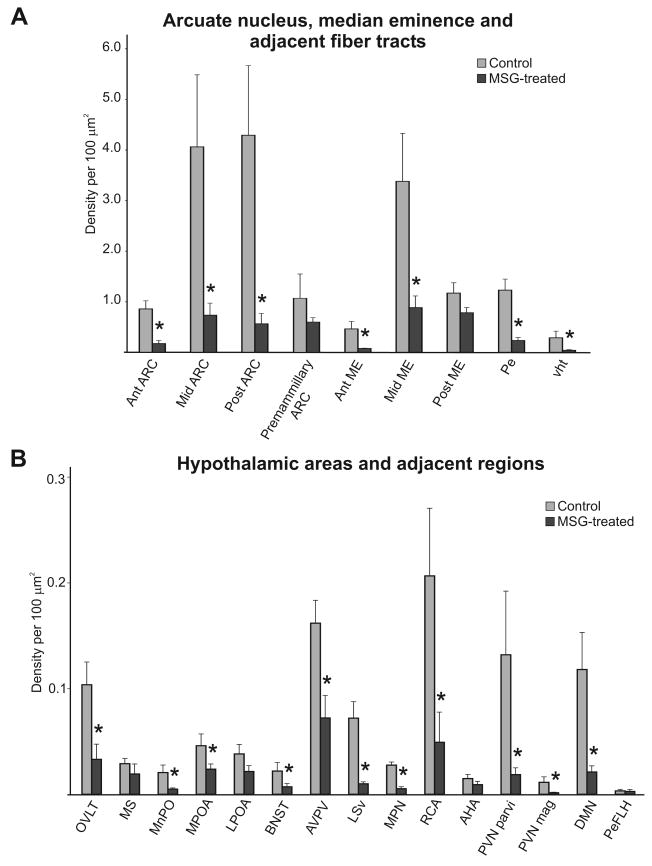
Figure 5.
Bar graphs showing quantitative analysis of NKB-immunoreactivity at multiple levels of the arcuate nucleus, median eminence and fiber tracts (A) and regions throughout the hypothalamus and adjacent areas (B) in control (gray bars) and MSG-treated (black bars) rats. Note the difference in scale between the two graphs indicative of the higher density of NKB-immunoreactivity the arcuate nucleus, median eminence and fiber tracts. Quantitative analysis revealed significantly reduced NKB-immunoreactivity in the arcuate nucleus, median eminence, fiber tracts and multiple hypothalamic areas of MSG-treated rats. n = 3 - 6 animals/group * significantly different from control, p ≤ 0.05.

