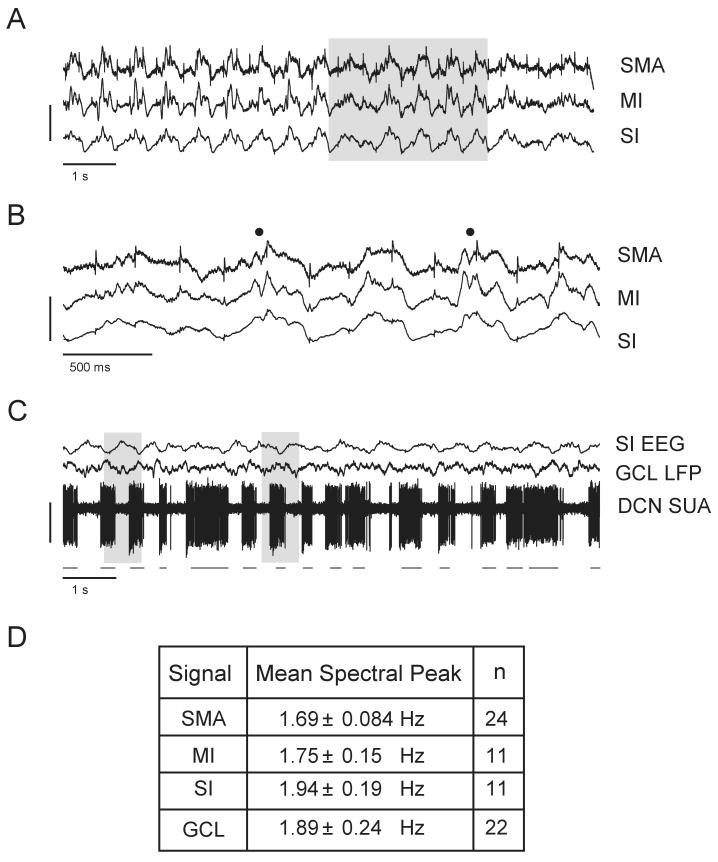
Figure 1. Common oscillatory rhythms in the cerebral cortex and cerebellum.
A: Simultaneous EEG signal recordings from the SMA, MI and SI cortical regions in one animal (see METHODS). All regions maintain a 1.5-2.5 Hz oscillation throughout the recording period. Vertical calibration bar (in μV): SMA (25); MI (50); SI (100). B: Inset of shaded area in A. Spindle oscillations are superimposed on the peaks of slower waves (marked by filled circles). Same vertical calibration as in A. C: Simultaneous cortical (SI) EEG, local field potential (LFP) activity in the granule cell layer (GCL) and single unit activity (SUA) in the DCN from same animal as in A and B. The EEG signal oscillates antiphasic to the GCL LFP and DCN signals (see shaded areas). A burst detection algorithm was used to determine burst onset and offset times during DCN spike activity. Black lines mark the detection of bursts based on Poisson Surprise values (see METHODS). Vertical calibration bar (in μV): SI (200); GCL (67); DCN (200). D: Table of mean frequencies of all filtered signals calculated from power spectra peaks.

