
Figure 5. IO oscillates in phase with cortex and DCN but did not consistently show influence on SI:DCN coherence.
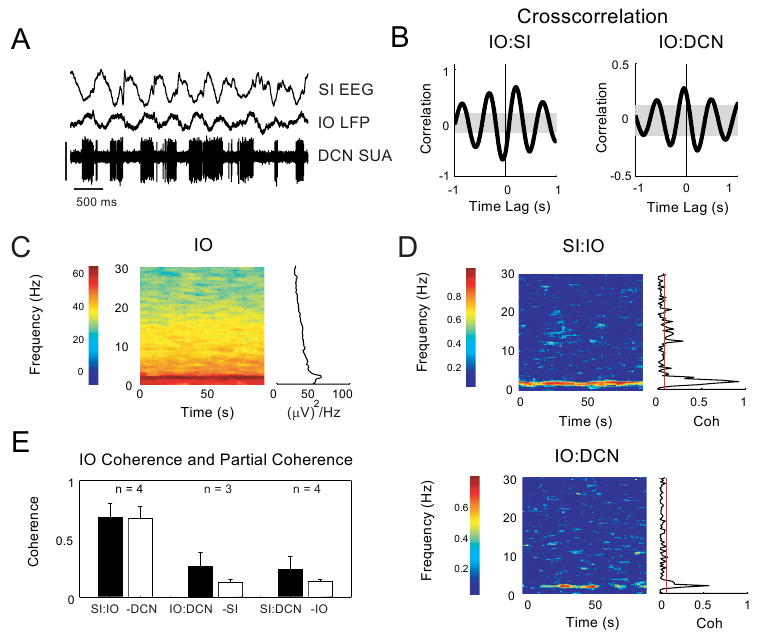
A: Raw data from a single animal showing simultaneous recordings from SI EEG, IO LFP and DCN SUA during SWA. Vertical calibration bar (in μV): SI (1000), IO (500), DCN (1000). B: Cross-correlation plots show that IO is antiphasic to SI and in phase with DCN (data from same animal as in A). C: A spectrogram plot of IO spontaneous activity during slow wave oscillations shows robust SWA and the presence of activity at lower power up to 30 Hz. (data from same animal as in A). D: Coherograms for SI:IO (top panel) and IO:DCN (bottom panel) show a robust peak at SWA frequencies (data from same animal as in A). E. Coherence between all paired signals is compared to the partial coherence when the third signal is removed. For each pair of signals, the maximum coherence was determined for the frequency range of 0.5 to 4 Hz and compared to the partial coherence calculated by removing the third signal. (standard error bars plotted; see RESULTS section).