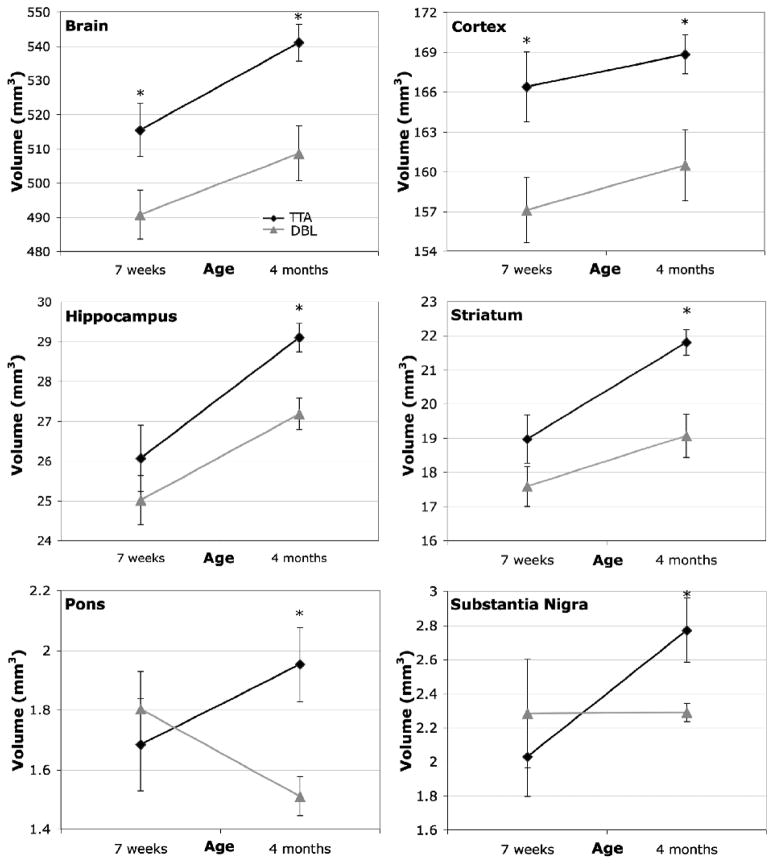
Figure 5.
Eight of the 33 structures analyzed differed in volume between genotypes at one or both ages examined. Six of the eight are highlighted here. Significant changes were observed in overall brain volume (p<0.04, ci=[−48.11, −1.11]) and cortex (p<0.03, ci=[−17.28, −1.3]) prior to the onset of amyloid in the DBL mice (7 weeks). Volume deficits in these two regions persisted in the older amyloid-positive animals (overall brain (p<0.007, ci=[−54.10, −10.83]) and cortical volume (p<0.02, ci=[−15.11, −1.58])), with additional volume losses developing in the hippocampus (p<0.005, ci=[−3.11, −0.73]), striatum (p<0.004, ci = [−4.38, −1.09]), pons (p< 0.01, ci=[−0.76, −0.13]), and substantia nigra (p<0.03, ci=[−0.91,−0.05]), cochlear nucleus (p< 0.008, ci=[−0.36, −0.07]; not shown) and cerebral peduncle (p<0.03, ci=[−0.67, −0.06]; not shown).

